


There has been a back and forth regarding the tariff headlines as traders and investors are clouded in uncertainties. Clearly, the economic war has narrowed to a face-off between the US and China. Meanwhile, if we take our eyes away from the headlines, what’s price telling us? In this article, we will use the Elliott wave theory to discuss the possible paths the S&P500 (SPX) could take in the coming weeks. Early in April, the US President, Donald Trump announced the largely anticipated tariff plans. Shortly afterwards and days after, most assets especially the risk assets started to bleed. Investors panicked and converted to cash until the dust settled. Afterwards, cash flows went into precious metals especially Gold which saw some of it’s biggest gains in the last 100 years. Gold reached record highs multiple times while the US Indices faltered. However, before the sell-off on the US Indices – S&P500 (SPX) and others, we had anticipated that the bullish cycle from October was getting completed. Thus, we warned members in our live sessions. However, we expected the expected decline to correct the cycle from August 2024 and then turn higher but the trade war impact had forced prices much lower to now correct the bigger bullish cycle from October 2022. In the Elliott wave terms, the bullish cycle from October 2022 marked the start of the wave ((III)) grand supercycle degree. From the lows of October 2022, price completed an impulse sequence for wave (I) of ((III)) in February 2025. Thus, from the high of February, wave (II) emerged. We intended to buy wave (II) if it completed a 3 or 7 swing structure.
SPX: A typical 3 or 7 swing pullback for (II)?
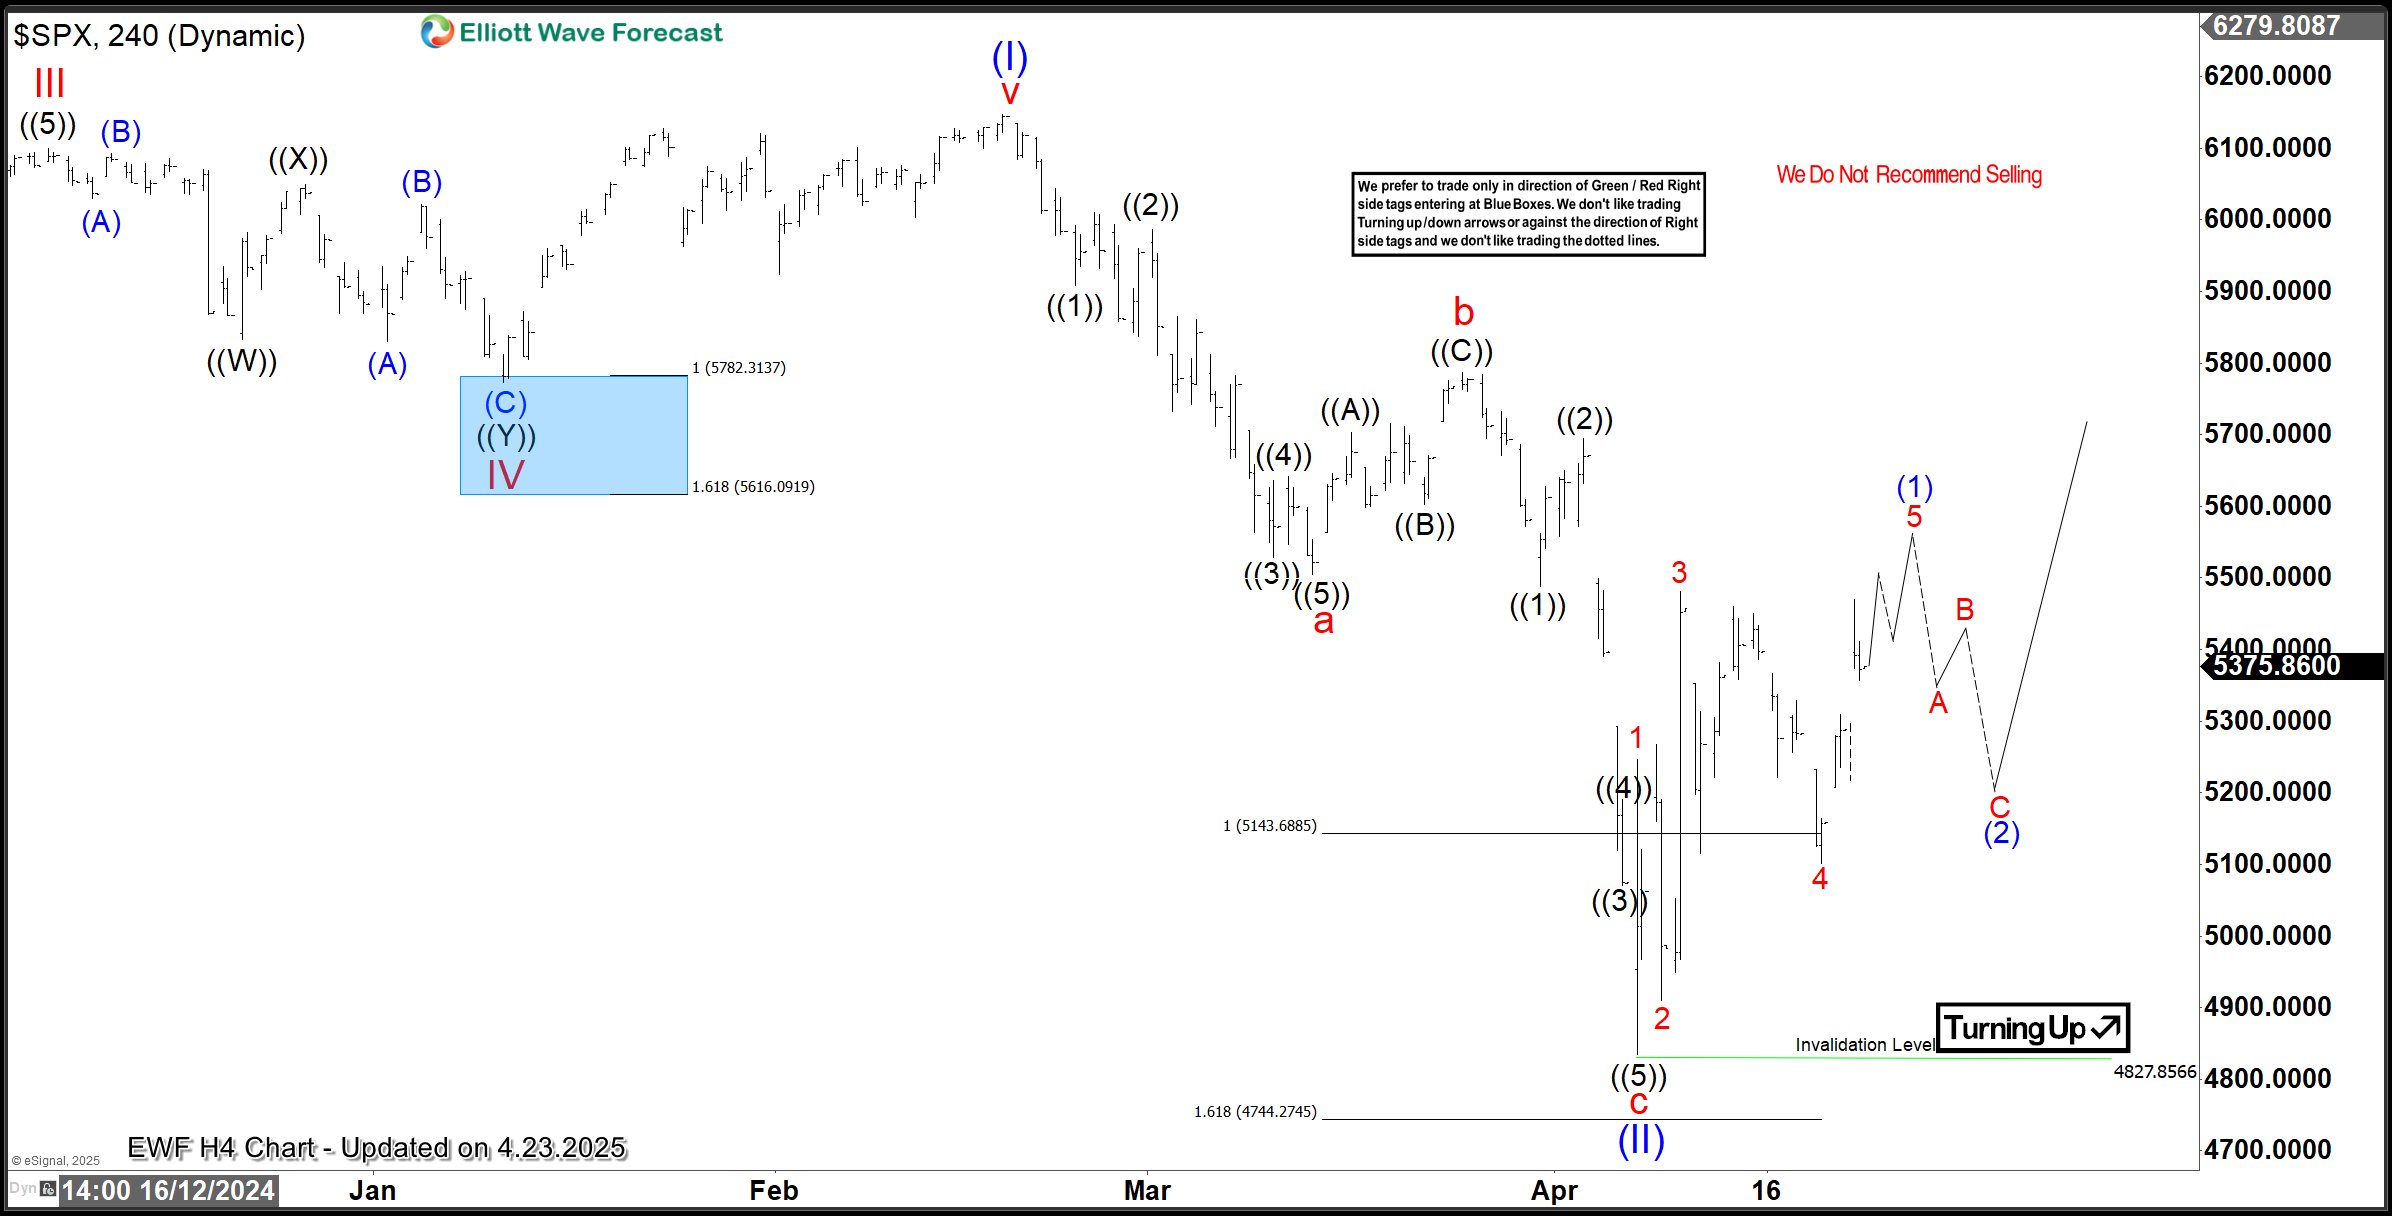
The first impact from the February high was a clear 3-swing decline that ended at the extreme area where we recommended members should buy for some profit.. Price rallied from the extreme as expected. Members reached the first target and are running a risk-free trade after taking partial profit. Going forward, the debate is whether the rally will be corrective or impulsive toward the February high. The chart below shows the scenario where wave ((II)) already finished at the April 2025 low.
SPX H4 – Ist Scenario
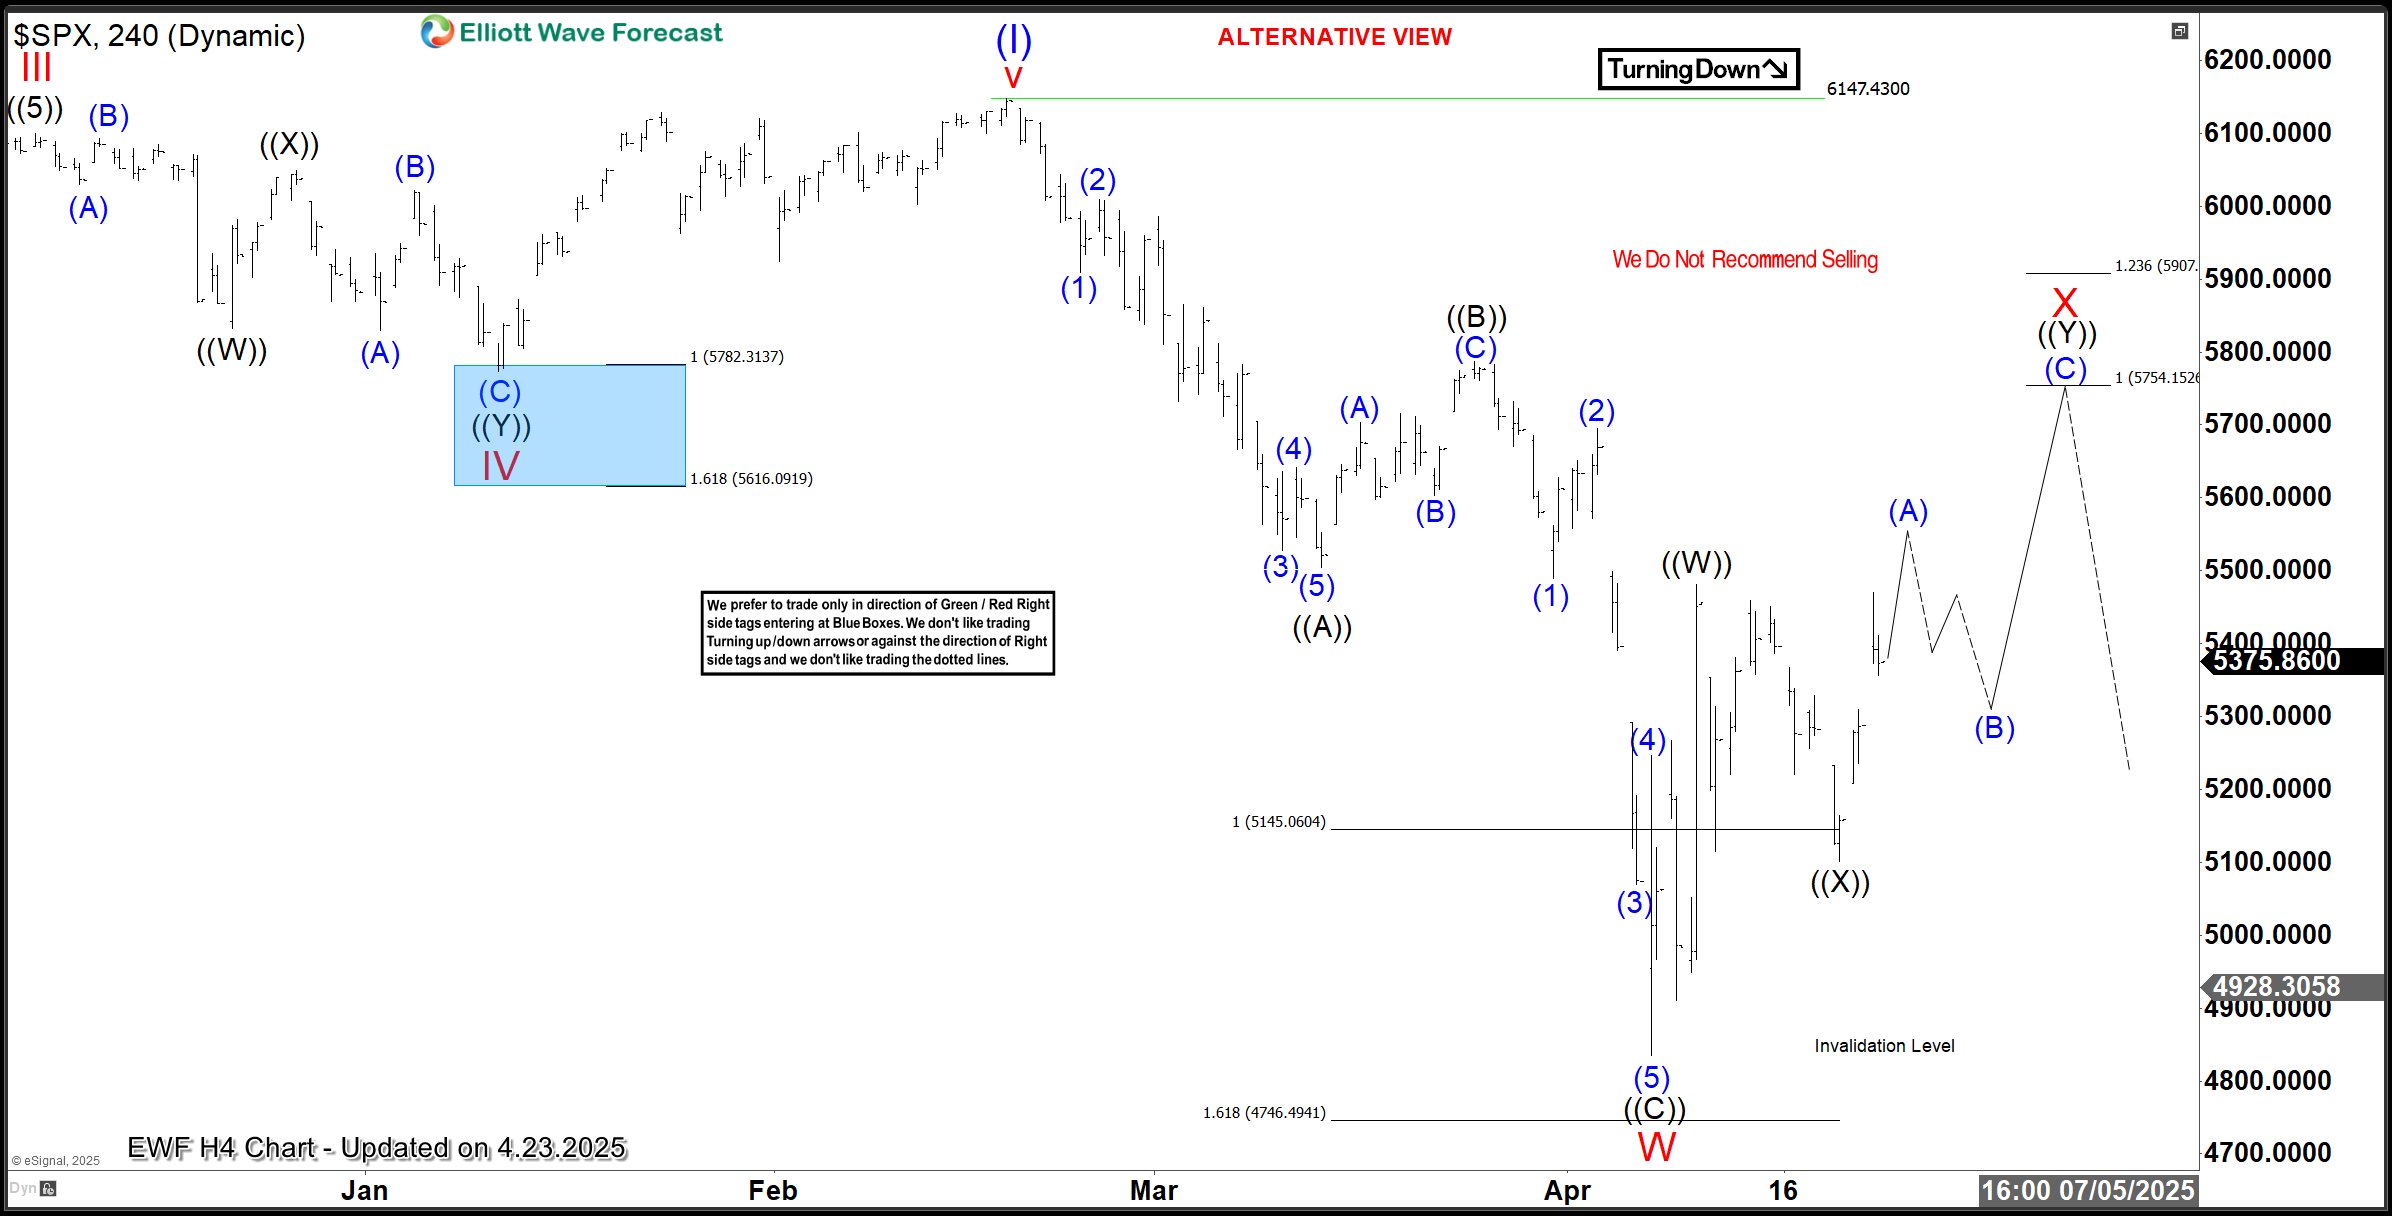
H4 – 2nd Scenario
About Elliott Wave Forecast
At www.elliottwave-forecast.com, we update one-hour charts four times daily and four-hour charts once daily for all 78 instruments. We also conduct daily live sessions to guide clients on the right side of the market. Additionally, we have a chat room where moderators answer market-related questions. Experience our service with a 14-day trial for only $9.99. Cancel anytime by contacting us at support@elliottwave-forecast.com.
The post S&P500 (SPX) Elliott Wave Forecasts Amid Tariff Uncertainties appeared first on Elliott wave Forecast.