
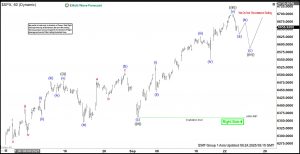

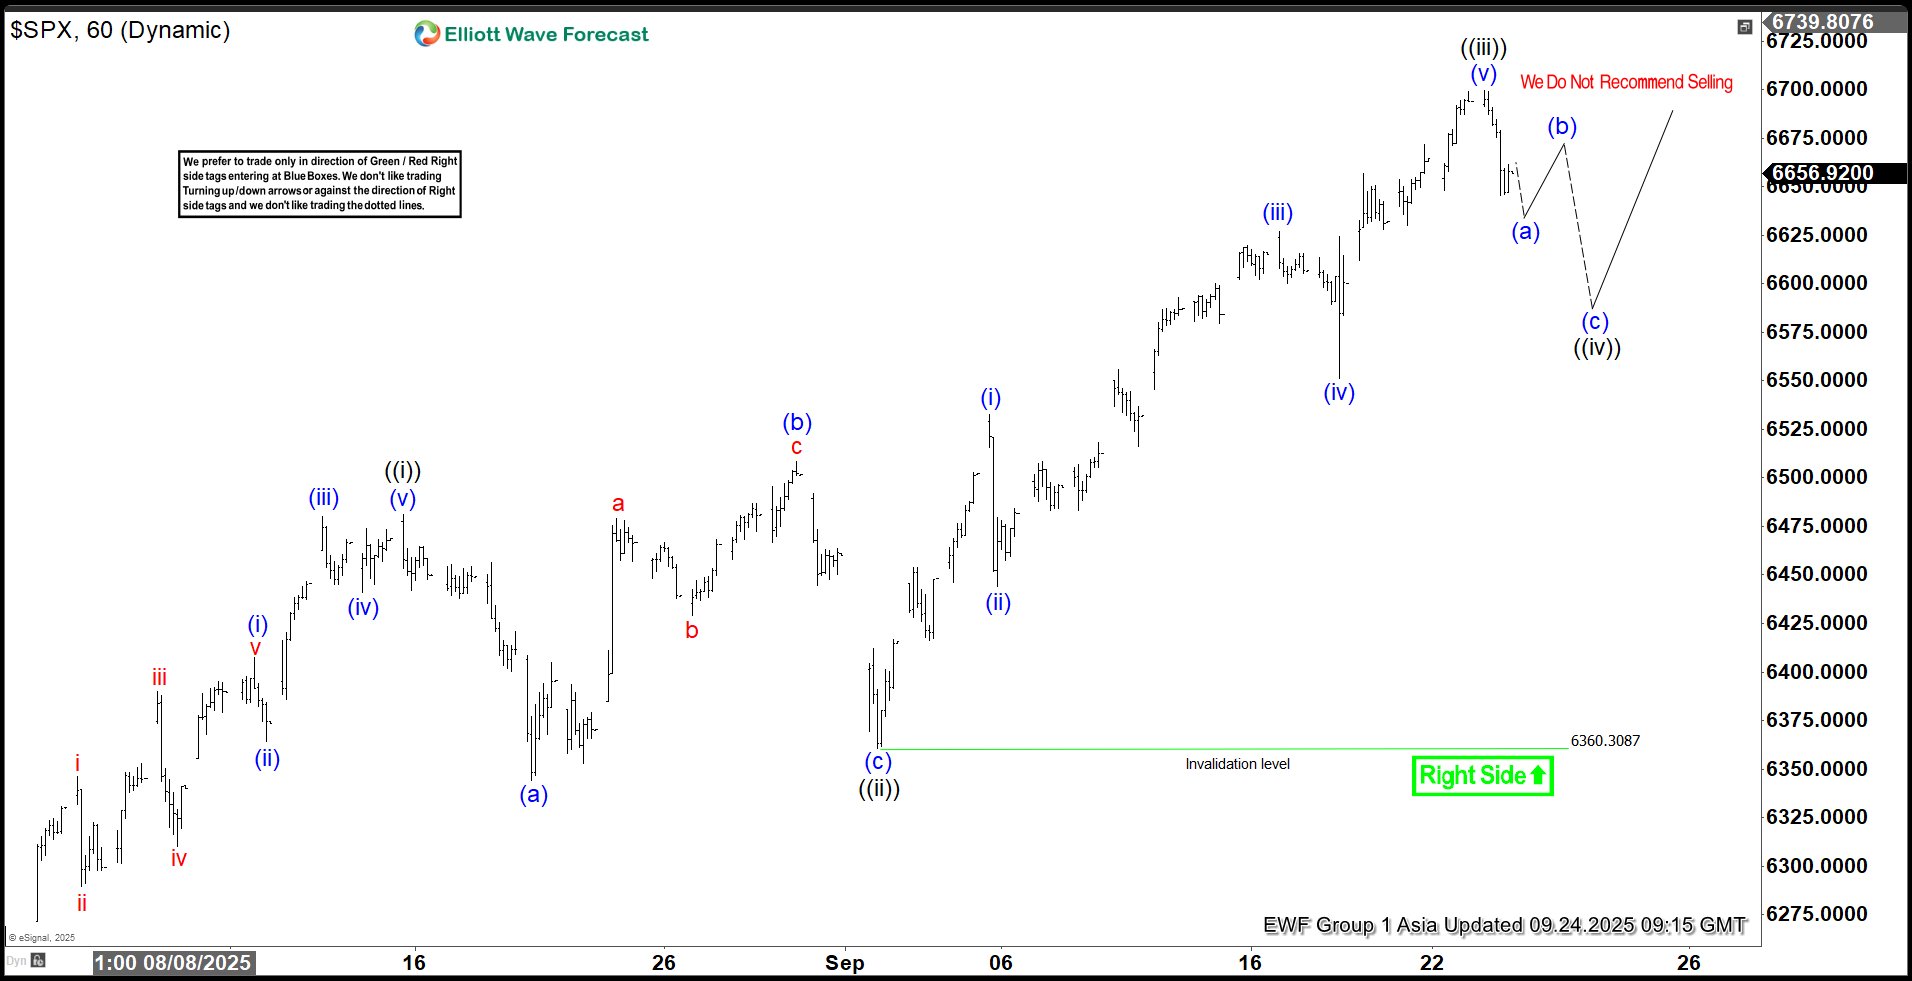
The short-term Elliott Wave analysis for the S&P 500 (SPX) indicates that the cycle starting from the August 2, 2025 low is unfolding as a five-wave structure. From that low, wave ((i)) concluded at 6481.34. The subsequent pullback in wave ((ii)) developed as a running flat Elliott Wave pattern. In this structure, wave (a) declined to 6343.86, wave (b) rallied to 6508.23, and wave (c) fell to 6360.3, completing wave ((ii)) at a higher degree. The Index then advanced in wave ((iii)). From the wave ((ii)) low, wave (i) reached 6532.65, followed by a dip in wave (ii) to 6443.98. The Index climbed higher in wave (iii) to 6626.99, with a pullback in wave (iv) ending at 6551.15. Wave (v) then pushed to 6699.52, finalizing wave ((iii)). Currently, wave ((iv)) is correcting the cycle from the September 2, 2025 low, expected to unfold in a 3, 7, or 11 swing pattern before the Index resumes its upward trajectory. In the near term, as long as the pivot low at 6360.3 holds, dips should attract buyers in a 3, 7, or 11 swing structure, supporting further upside. S&P 500 (SPX) – 60 Minute Elliott Wave Technical Chart:
SPX – Elliott Wave Technical Video:
The post S&P 500 (SPX) Remains Bullish and Should See Support in 3, 7, 11 Swing appeared first on Elliott Wave Forecast.