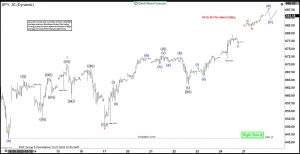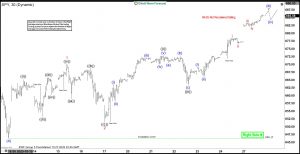
The short-term Elliott Wave analysis for the S&P 500 ETF (SPY) indicates an ongoing bullish cycle that began at the April 2025 low, unfolding as a five-wave impulse structure. As shown in the 30-minute chart, wave (4) of this impulse concluded at 646.17. The final leg, wave (5), is currently underway, characterized by an internal five-wave structure with nested subdivisions. From wave (4), wave ((i)) peaked at 665.13, followed by a pullback in wave ((ii)) to 653.17. Wave ((iii)) then advanced to 665.83, with a subsequent dip in wave ((iv)) to 660.28. The final wave ((v)) reached 670.23, completing wave 1 on a higher degree. Subsequently, the ETF corrected in wave 2, forming a zigzag Elliott Wave pattern that bottomed at 651.41. From wave 1’s peak, wave ((a)) declined to 658.93, followed by a rally in wave ((b)) to 668.71. Wave ((c)) then dropped to 651.41, finalizing wave 2. The ETF has since resumed its upward trajectory in wave 3. From wave 2’s low, wave ((i)) climbed to 672.99, and wave ((ii)) dipped to 663.30. In the near term, anticipate a pullback finding support in a 3, 7, or 11 swing against 646.17, setting the stage for further upside. This analysis suggests continued bullish momentum with well-defined support levels guiding the next moves.
S&P 500 ETF (SPY) Latest 30-Minutes Elliott Wave Chart From 10.28.2025
SPY Elliott Wave Video:
The post S&P 500 ETF (SPY) Advances with Nested Structure in Wave (5) appeared first on Elliott Wave Forecast.


