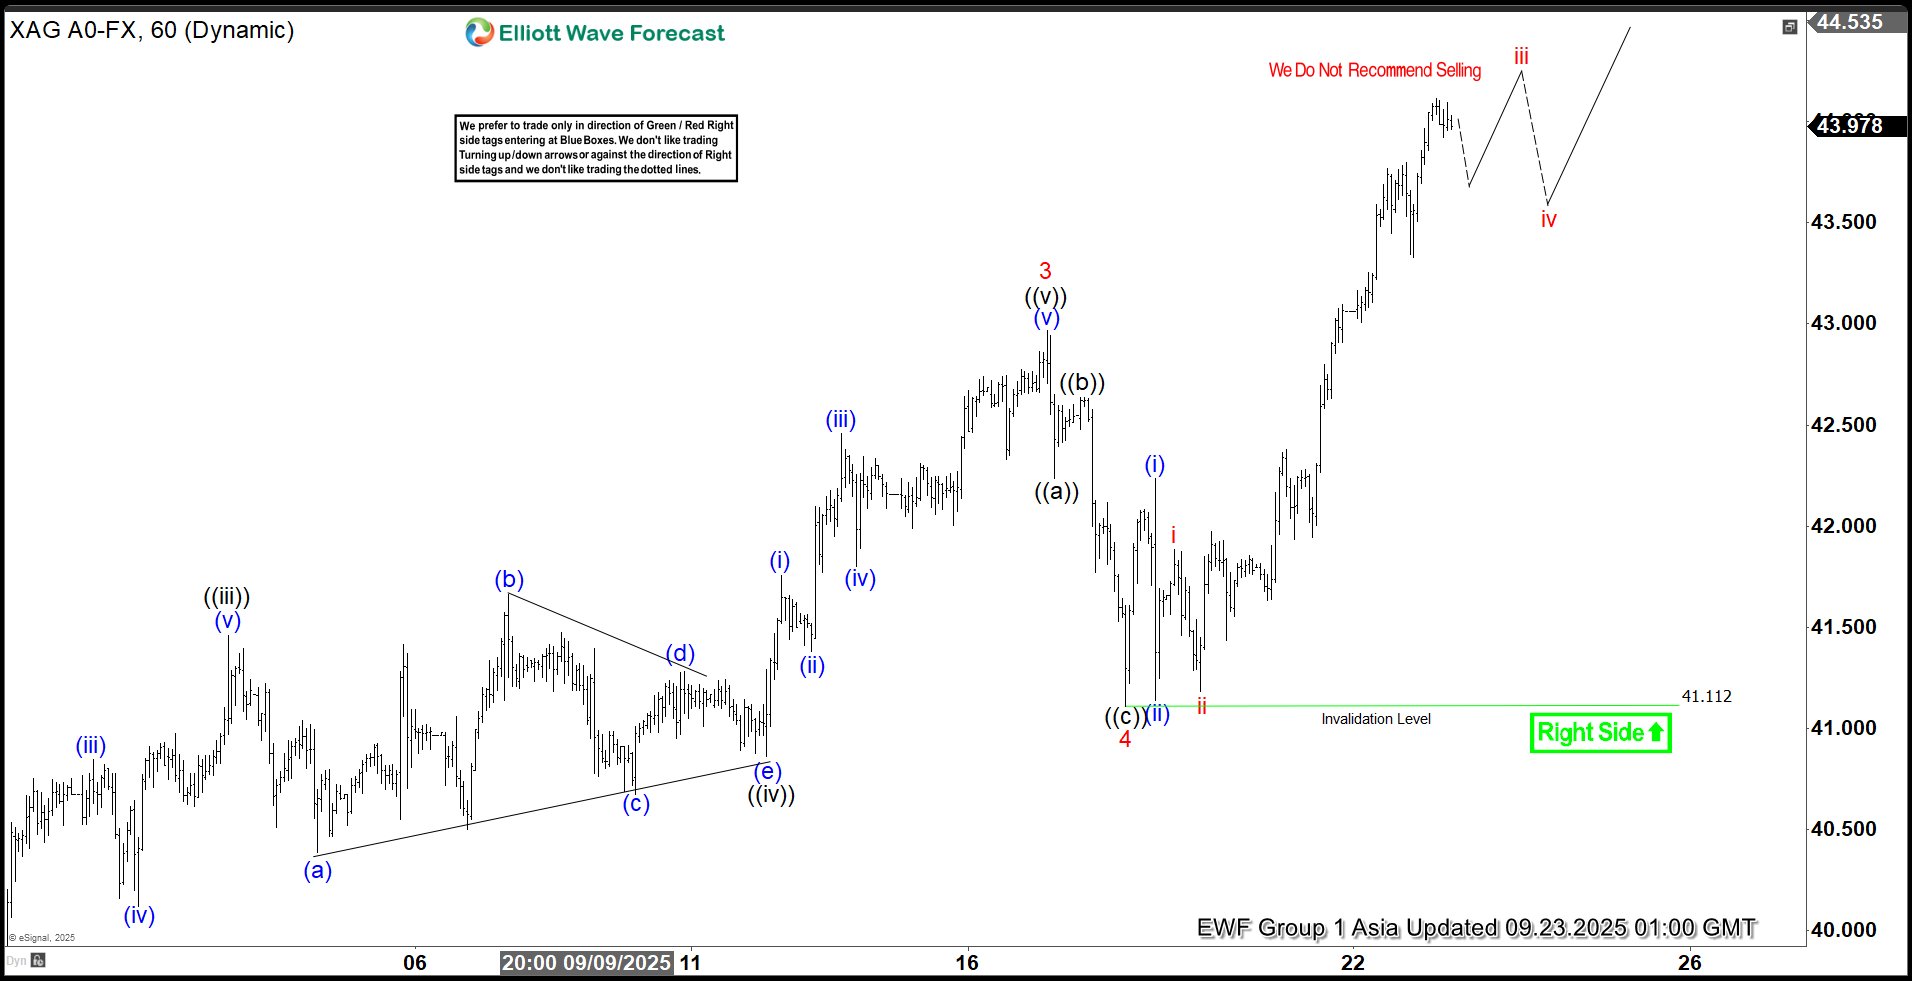
The short-term Elliott Wave analysis for Silver (XAGUSD) indicates a robust impulsive rally that began on July 31. From that low, the metal surged, completing wave 1 at $38.73, followed by a corrective pullback in wave 2 that concluded at $36.94. The upward momentum resumed in wave 3, which peaked at $42.96, as illustrated on the one-hour chart. Subsequently, wave 4 unfolded as a zigzag structure, with wave ((a)) terminating at $42.23 and wave ((b)) reaching $42.636. The decline in wave ((c)) finalized at $41.11, marking the completion of wave 4 in the higher degree. Silver then turned higher in wave 5, exhibiting an internal structure of five smaller-degree waves. From the wave 4 low, wave (i) advanced to $42.23, followed by a dip in wave (ii) to $41.13. The metal continued its ascent, with wave i concluding at $41.88 and wave ii finding support at $41.18. In the near term, as long as the price remains above $41.11, dips are expected to attract buyers in a 3, 7, or 11-swing sequence, supporting further upward extensions. This analysis suggests that Silver’s bullish trend remains intact, with potential for additional gains as the impulsive structure continues to develop. Silver (XAGUSD) – 60 Minute Elliott Wave Technical Chart:
XAGUSD – Elliott Wave Technical Video:
The post Silver (XAGUSD) Elliott Wave Outlook: Powerful Bullish Rally in Motion appeared first on Elliott Wave Forecast.


