

D-Wave Quantum Inc., (QBTS) develops & delivers quantum computing systems, software & services worldwide. It comes under Technology sector & trades as “QBTS” ticker at Nasdaq. It rises almost 41 times since November-2024 & can see more upside against August-2025 low. Since inception in 2020, it made all time low of 0.40 on May-2023. After that it trade higher and consolidated since November-2024 breakout. Currently, it is trading in bullish sequence against 8.20.2025 low & may extend into $41.25 – $43.95 area before pullback. We like to buy the next correction in 3, 7 or 11 swings at extreme area against August low. Since May-2023 low, it started bullish impulse rally & now trading in ((3)) of I. It placed (1) of ((1)) at $3.20 high, (2) at 0.57 low, (3) at $10.50 high, (4) at $5.60 low & (5) at $11.41 high on 12.27.2024. It ended ((2)) at $3.74 low on 1.13.2025 as more than 0.618 Fibonacci retracement. Above there, it placed (1) of ((3)) at $20.56 high, (2) at $14.20 low & rallying in (3). Within (1), it ended 1 at $11.95 high, 2 at $5.77 low, 3 at $19.77 high, 4 at $14.29 low & 5 at $20.56 high. It ended (2) pullback as double correction at $14.20 low on 8.20.2025.
QBTS – Elliott Wave Latest Daily View: 
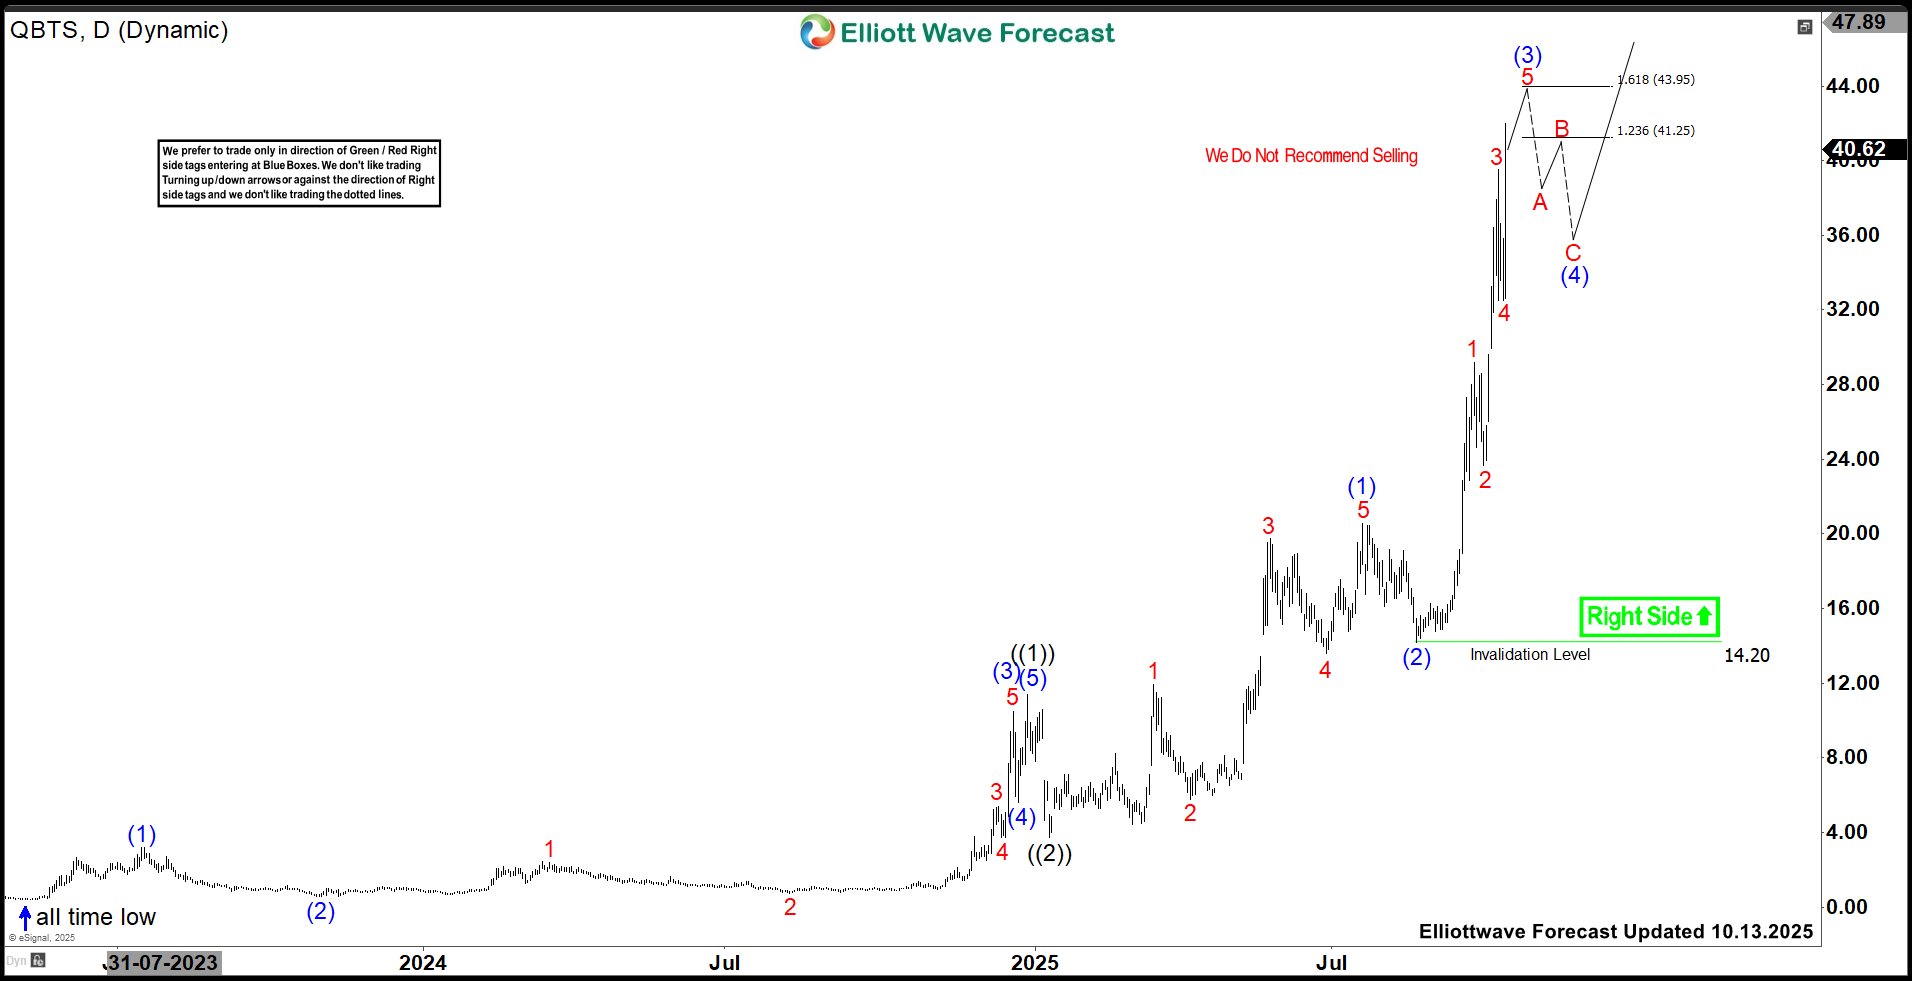
Above (2) low, it placed 1 of (3) at $29.18 low, 2 at $23.67 low, 3 at $39.55 high, 4 at $32.49 low & favors rally in 5 to finish (3). It expects rally to extend into $41.25 – $43.95 area to finish (3) before starts pullback in (4) against August low. But if breaks above $43.95, it can extend towards $46.87 – $47.93 area to finish (3) as long as high comes with momentum divergence. It already reached the minimum extreme area, so chasing longs at the moment is risky, but do not like selling. We like to buy the next pullback in 3, 7 or 11 swings in (4), correcting against August low. Generally, (4) can pullback between 0.236 – 0.382 Fib retracement of (3), which measured once (3) ends. QBTS is not the part of regular service at EWF. But we provide time to time updates on instrument under blog section. Elliottwave Forecast updates 1-hour charts four times a day & 4-hour charts once a day for all our 78 instruments. We do a daily live session, where we guide our clients on the right side of the market. In addition, we have a chat room where our moderators will help you with any questions you have about what is happening in the market at the moment. You can try our services for 14 days at $0.99. Also, you can check out the Educational section to learn Elliott wave theory & its application through different packages available & 1-1 coaching for doubts.
The post QBTS Elliott Wave View: Buyers Should Wait For Pullback appeared first on Elliott Wave Forecast.