

PepsiCo appears to have completed the bearish cycle from May 2023. In the coming weeks, price action that supports a new bullish cycle, leading to a new high, could emerge. Meanwhile, in the previous forecast on this stock, we highlighted a high probability buying zone, using the blue box. In this post, we will discuss how the blue box has provided a reliable trading zone for traders. In addition, we will discuss what to expect next. PepsiCo is a global food and beverage company with the headquarters in New York. It was founded in 1965 through the merger of Pepsi-Cola and Frito-Lay. The company operates in over 200 countries and has a diverse portfolio of brands, including Pepsi, Mountain Dew, Lay’s, Doritos, Gatorade, Tropicana, and Quaker. Pepsico is in an all-time bullish sequence. Therefore, pullbacks have provided opportunities for buyers to buy the dip. A new corrective pullback emerged from May 2023. For over 24 months, this pullback evolved into a clear corrective structure. At the end of the corrective structure, the long-term bullish trend should resume. From the Elliott wave perspective, we reckoned that the peak of May 2023 marked the end of the wave (III) of ((III)) of the all-time bullish cycle. Thus, the pullback from that high was expected to conclude wave (IV) of ((III)), followed by a resurgence to a fresh record high.
PepsiCo Elliott Wave Setup (Weekly) – 02.16.2025
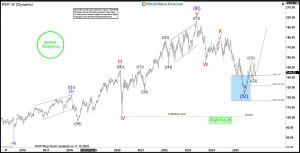
On 16 February, 2025 we did n analytical blog post on PepsiCo. The update explained the all-time bullish trend and the the wave (IV) pullback from the top of May 2023. In the update, we shared the chart below.  The weekly chart above displays a clear double zigzag structure for wave (IV). We identified the 142.13-116.60 range as the blue box zone. We anticipated either a new bullish cycle from this zone or, at minimum, a 3-swing bounce. The price eventually reached the blue box a few months later and bounced sharply, as shown in the chart below.
PepsiCo Elliott Wave Setup Update (Weekly) – 11.16.2025
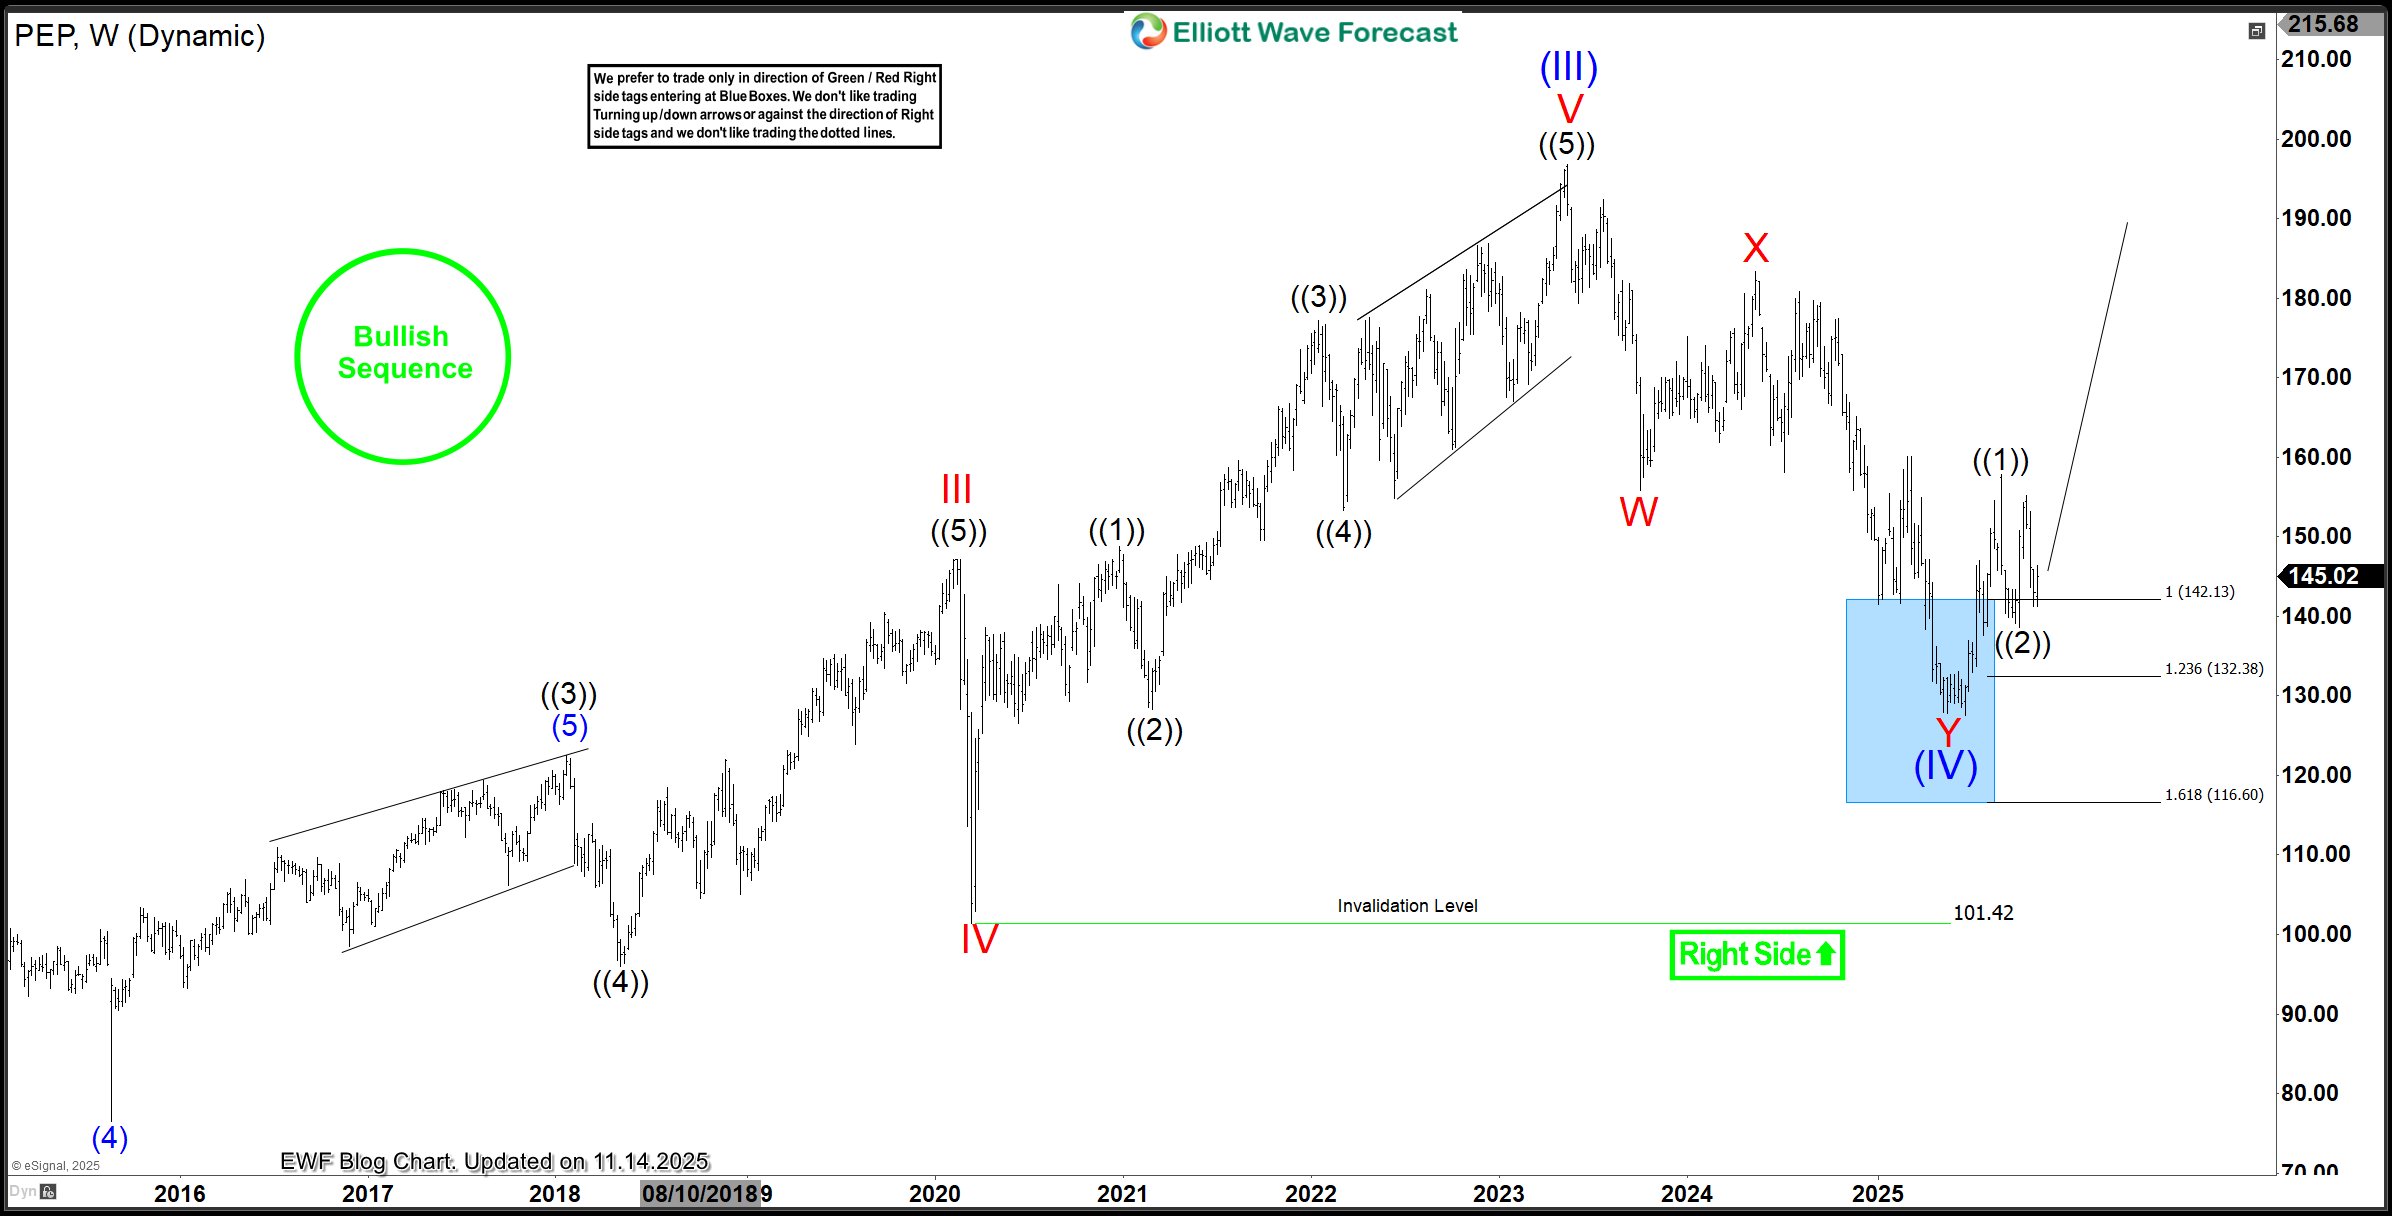 The new weekly chart above shows a sharp rebound. This could signify the end of wave (IV) or the start of a 3/7 swing bounce leading to a deeper wave (IV). If wave (IV) has ended, wave (V) should advance to $215 and potentially higher. However, if the bounce is corrective, buyers should anticipate a price reach of $168-$175. Traders who went long from the blue box have already reached the first target at 156.33. Therefore, while booking some profits, buyers can continue to hold the rest of their position with a stop adjusted to $127. This appears to be a solid plan. Looking at the shorter cycles, what’s next?
PepsiCo Elliott Wave Setup Update (4-Hour) – 11.16.2025
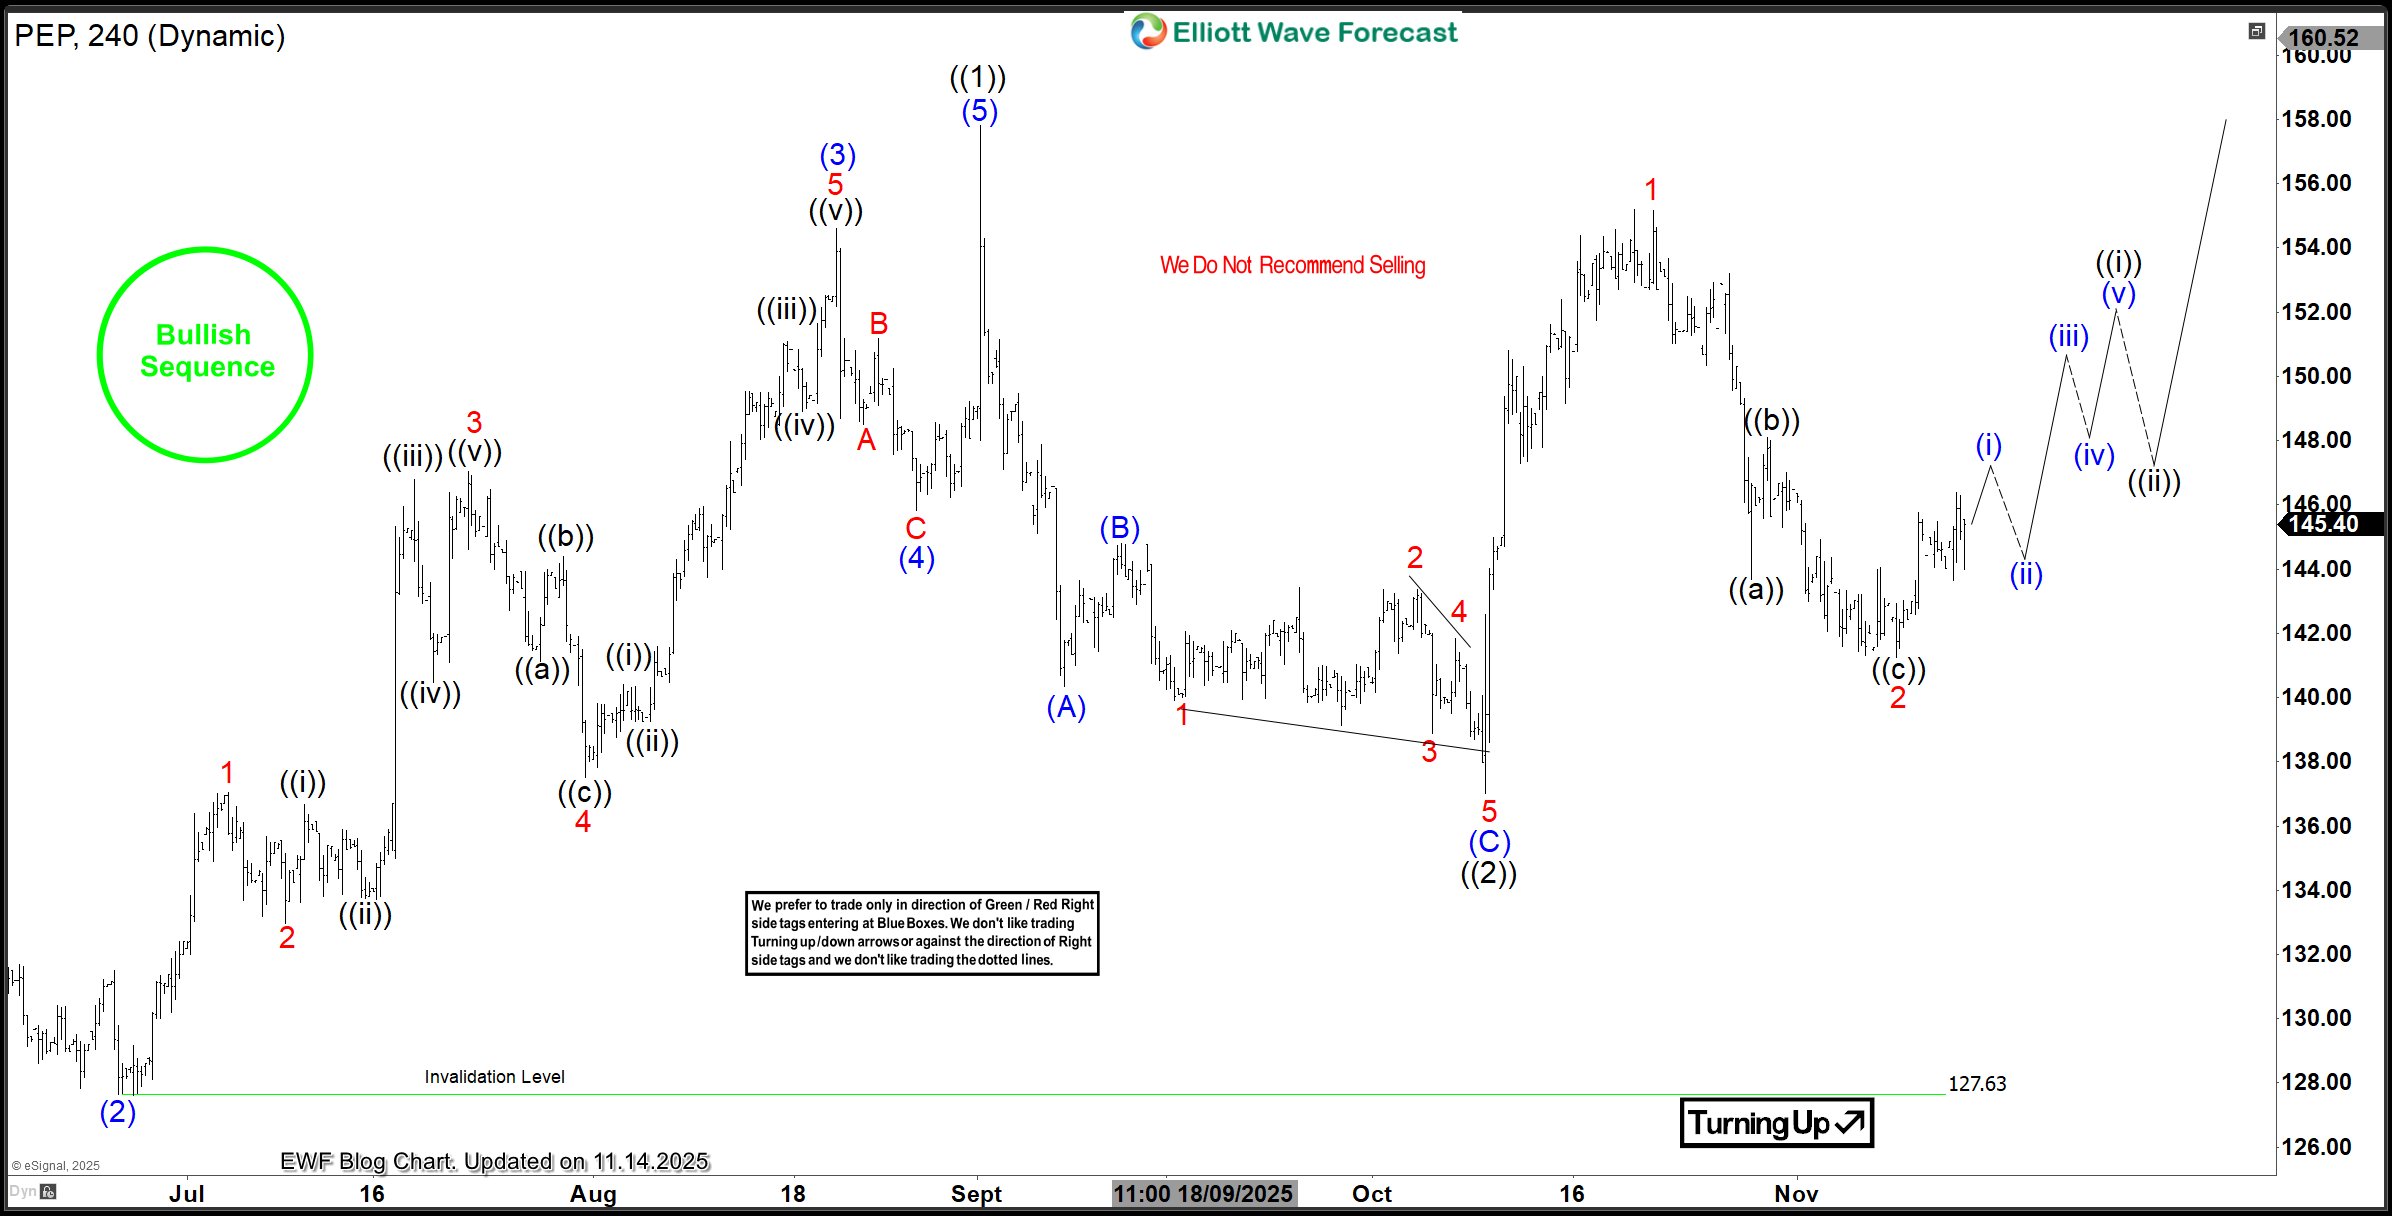 The PepsiCo H4 chart above shows price turning up against the 127.63 pivot. This indicates that as long as this low holds, an upward trend is likely to continue. The chart also shows the price in a nesting position, specifically in wave 3 of (1) of ((3)), following the completion of waves ((1)) and ((2)) of I of (V) at the May 2023 high and June 2025 low, respectively. In the short term, if wave 3 unfolds as anticipated, it should advance to the $160-$170 area.
About Elliott Wave Forecast
At www.elliottwave-forecast.com, we update one-hour charts four times daily and four-hour charts once daily for all 78 instruments. We also conduct daily live sessions to guide clients on the right side of the market. Additionally, we have a chat room where moderators answer market-related questions. Experience our service with a 14-day trial for only $9.99. Cancel anytime by contacting us at support@elliottwave-forecast.com.
The post PepsiCo Analysis: Elliott Wave Signals a Possible Rally Toward $215 appeared first on Elliott Wave Forecast.