

Hello traders. In this technical article we’re going to look at the Elliott Wave charts of Oil commodity (CL_F) published in members area of the website. OIL has recently given us a 3 waves recovery that found sellers as expected. In this discussion, we’ll break down the Elliott Wave forecast.
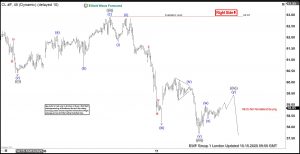
OIL Elliott Wave 1 Hour Chart 10.15.2025
OIL ended a 5-wave decline in the cycle from the 62.93 peak. Currently, the commodity is showing a recovery against that peak: wave ((iv)). We recommend that members avoid buying OIL at this stage and instead favor the short side. As our members know, wave ((iv)) usually ends within the 23.6–38.2% Fibonacci retracement zone, measured from the starting point of wave ((ii)), which in this case is the 62.93 peak. Therefore, we expect OIL to complete its ((iv)) recovery at 58.45–59.21. The price is already within the sellers’ zone, and we anticipate another leg down from this area.
You can learn more about Elliott Wave Patterns at our Free Elliott Wave Educational Web Page
90% of traders fail because they don’t understand market patterns. Are you in the top 10%? Test yourself with this advanced Elliott Wave Test 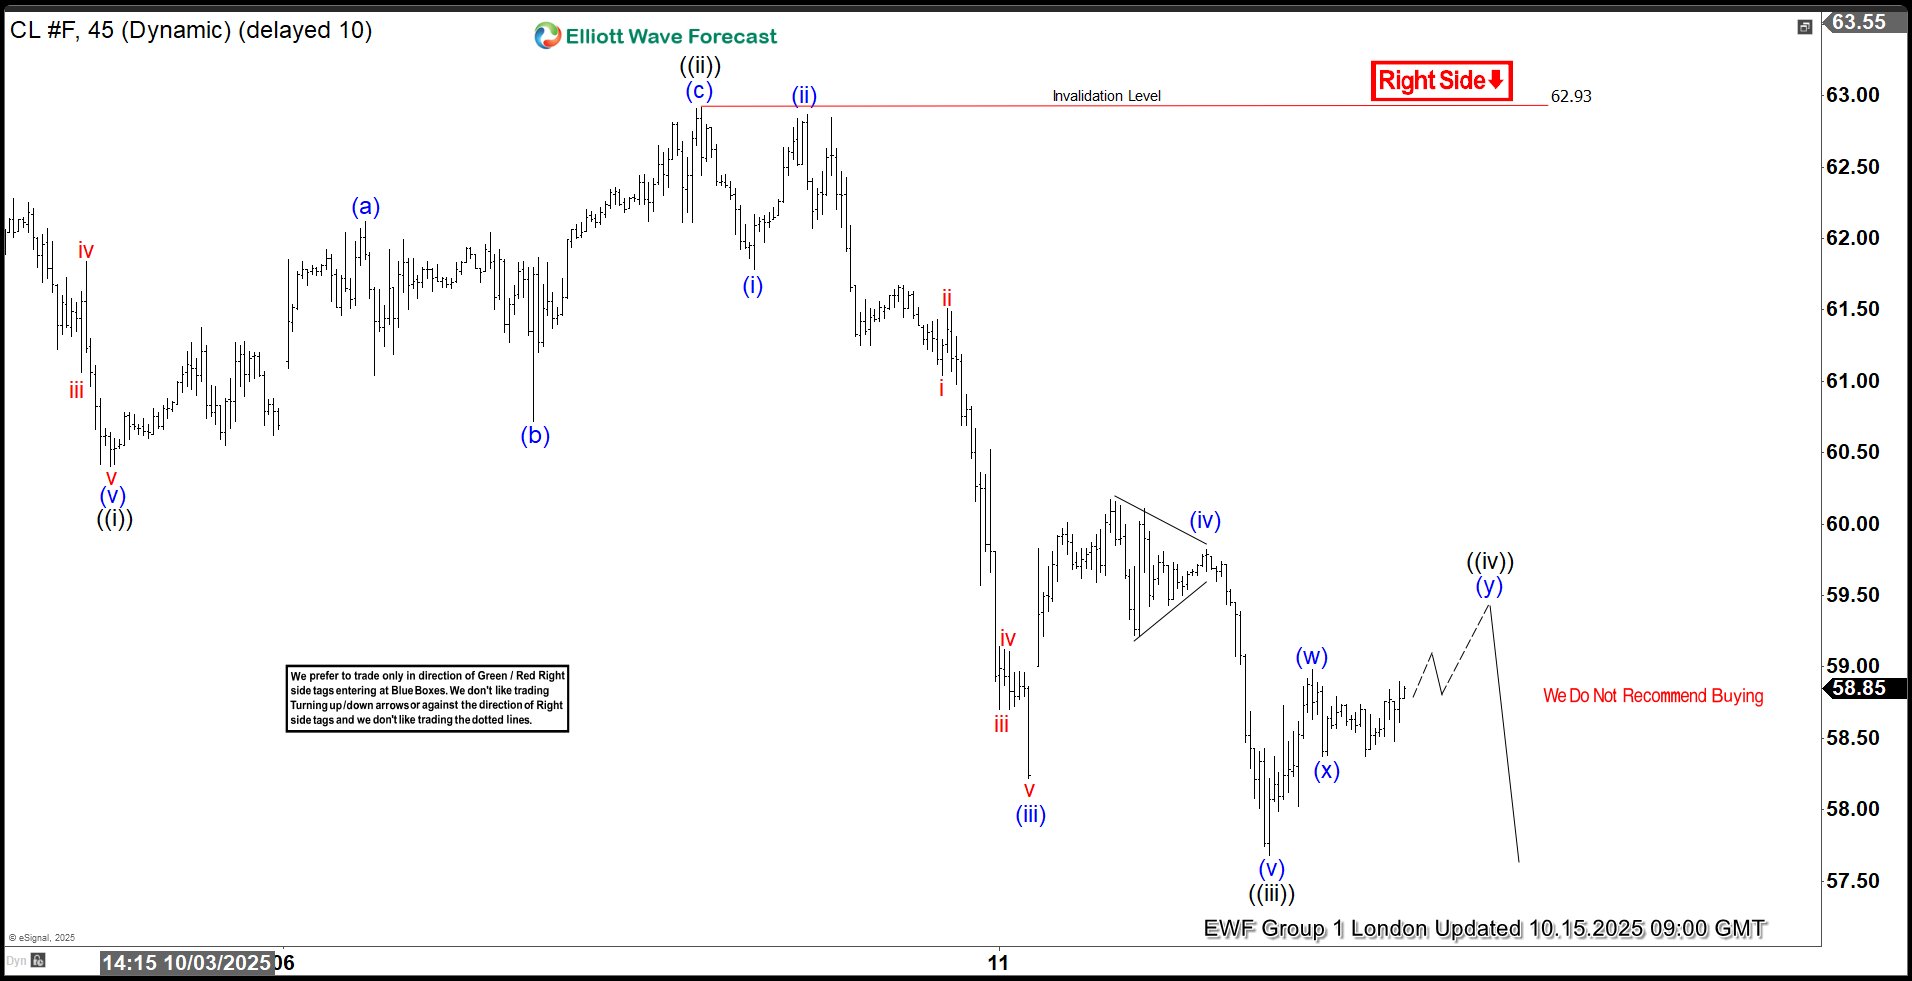
OIL Elliott Wave 1 Hour Chart 10.18.2025
The commodity ended wave ((iv)) within the mentioned zone as expected. We got decline toward new lows as expected. The price is currently in wave ((v)) which has already reached the minimum target at 56.82-56.15. We got this target by measuring inverse 1.236-1.618 fib extension zone of wave ((iv)). However, short term structure in wave ((v)) looks incomplete at this moment. So we believe another low still can be seen before bounce takes place in OIL. Remember, the market is dynamic, and the presented view may have changed in the meantime. For the most recent charts and target levels, please refer to the membership area of the site. The best instruments to trade are those with incomplete bullish or bearish swing sequences. We put them in Sequence Report and best among them are presented in the Live Trading Room Reminder for members: Our chat rooms in the membership area are available 24 hours a day, providing expert insights on market trends and Elliott Wave analysis. Don’t hesitate to reach out with any questions about the market, Elliott Wave patterns, or technical analysis. We’re here to help. 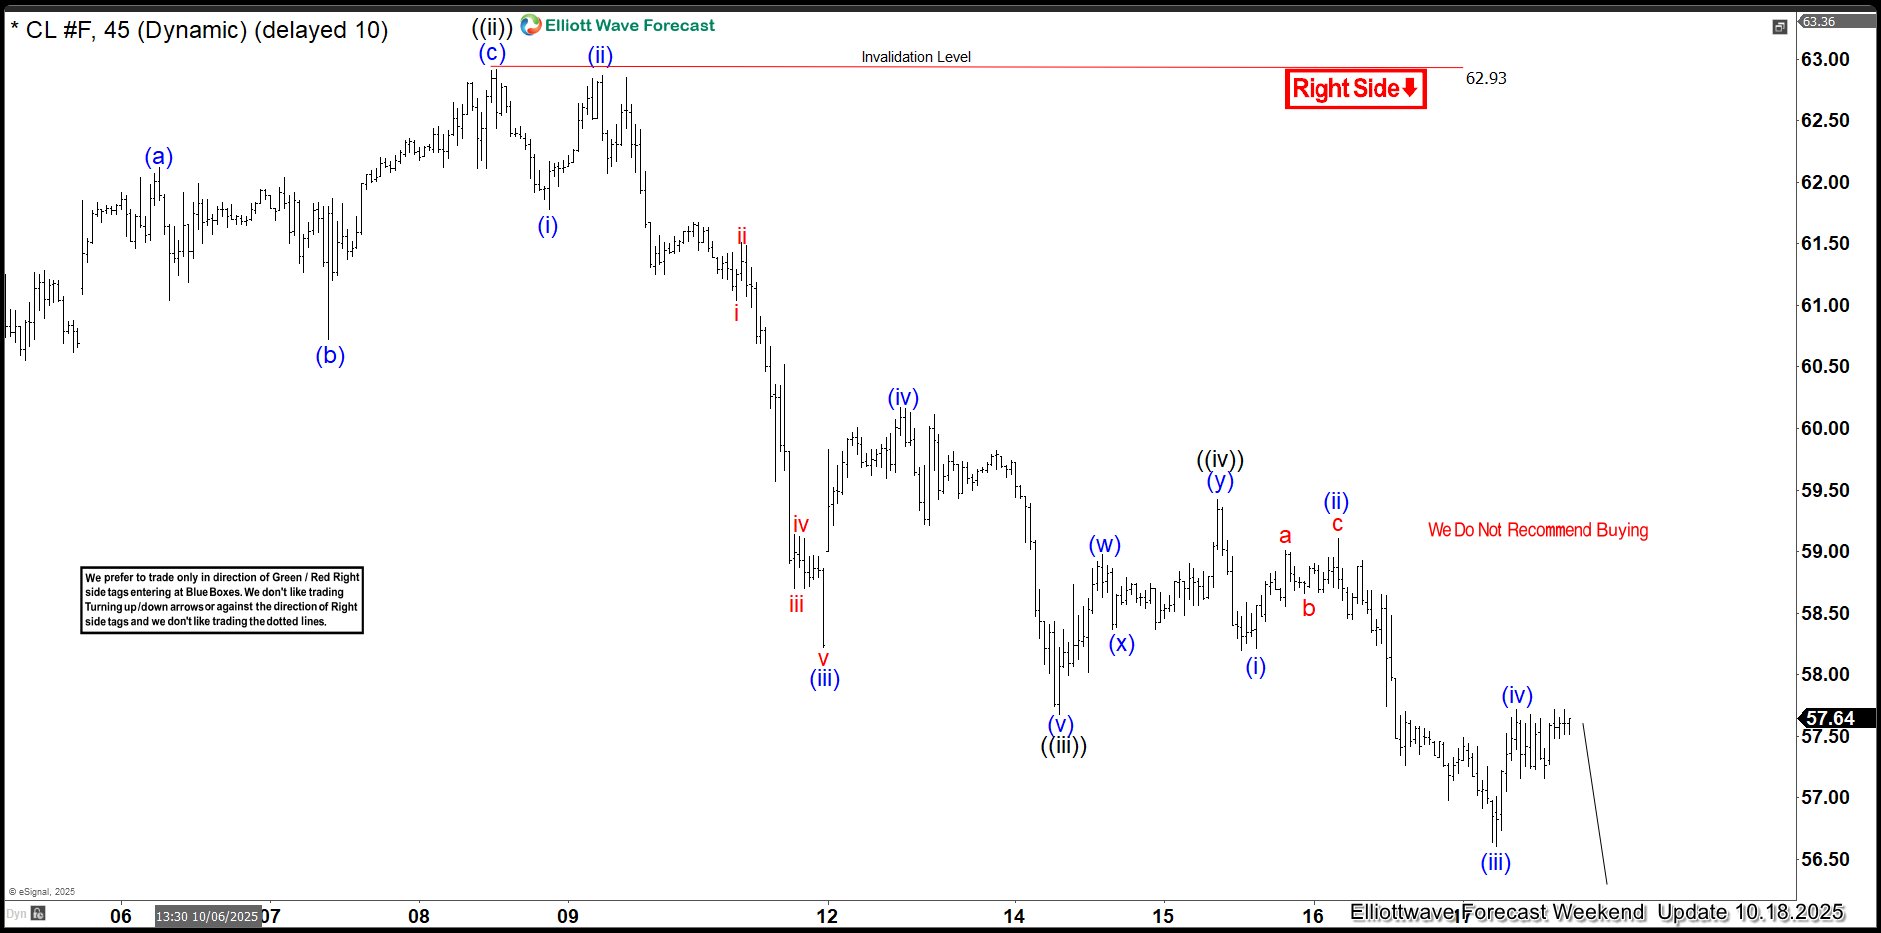
Elliott Wave Forecast
At Elliott Wave Forecast, we track and analyze 78 instruments daily — but remember, not every chart is a direct trading signal.
For real-time, actionable trades, join our Live Trading Room, where we guide you through clear, professional setups every day.
🚀 Not a member yet? Now’s the perfect time, we have limited time Promo Offer :
Unlock full access with our 14-day Trial for just $0.99!
Here’s what you’ll get:
✅ Official Trading Signals — with clearly defined Entry, Stop Loss, and Take Profit levels based on our proven strategy.
✅ Live 24 Hour Chat Room Access — ask unlimited questions and get expert support during trading hours (Monday–Friday).
✅ Expert Analysis — real-time updates across Forex, Stocks, Indices, Commodities, Cryptos, and ETFs.
✅ Hands-on Learning — sharpen your trading skills with direct mentorship from seasoned market analysts.
💬 Whether you’re an experienced trader or just getting started, Elliott Wave Forecast provides the tools, strategies, and support you need to trade with confidence.
Take the first step toward better, smarter trading 👉 Click here to start your Trial today!

The post OIL CL_F Drops in Wave ((v)) – Minimum Target Hit! appeared first on Elliott Wave Forecast.