


5 Wave Impulse Structure + ABC correction

$MSFT Weekly Elliott Wave Chart 3.30.2025:
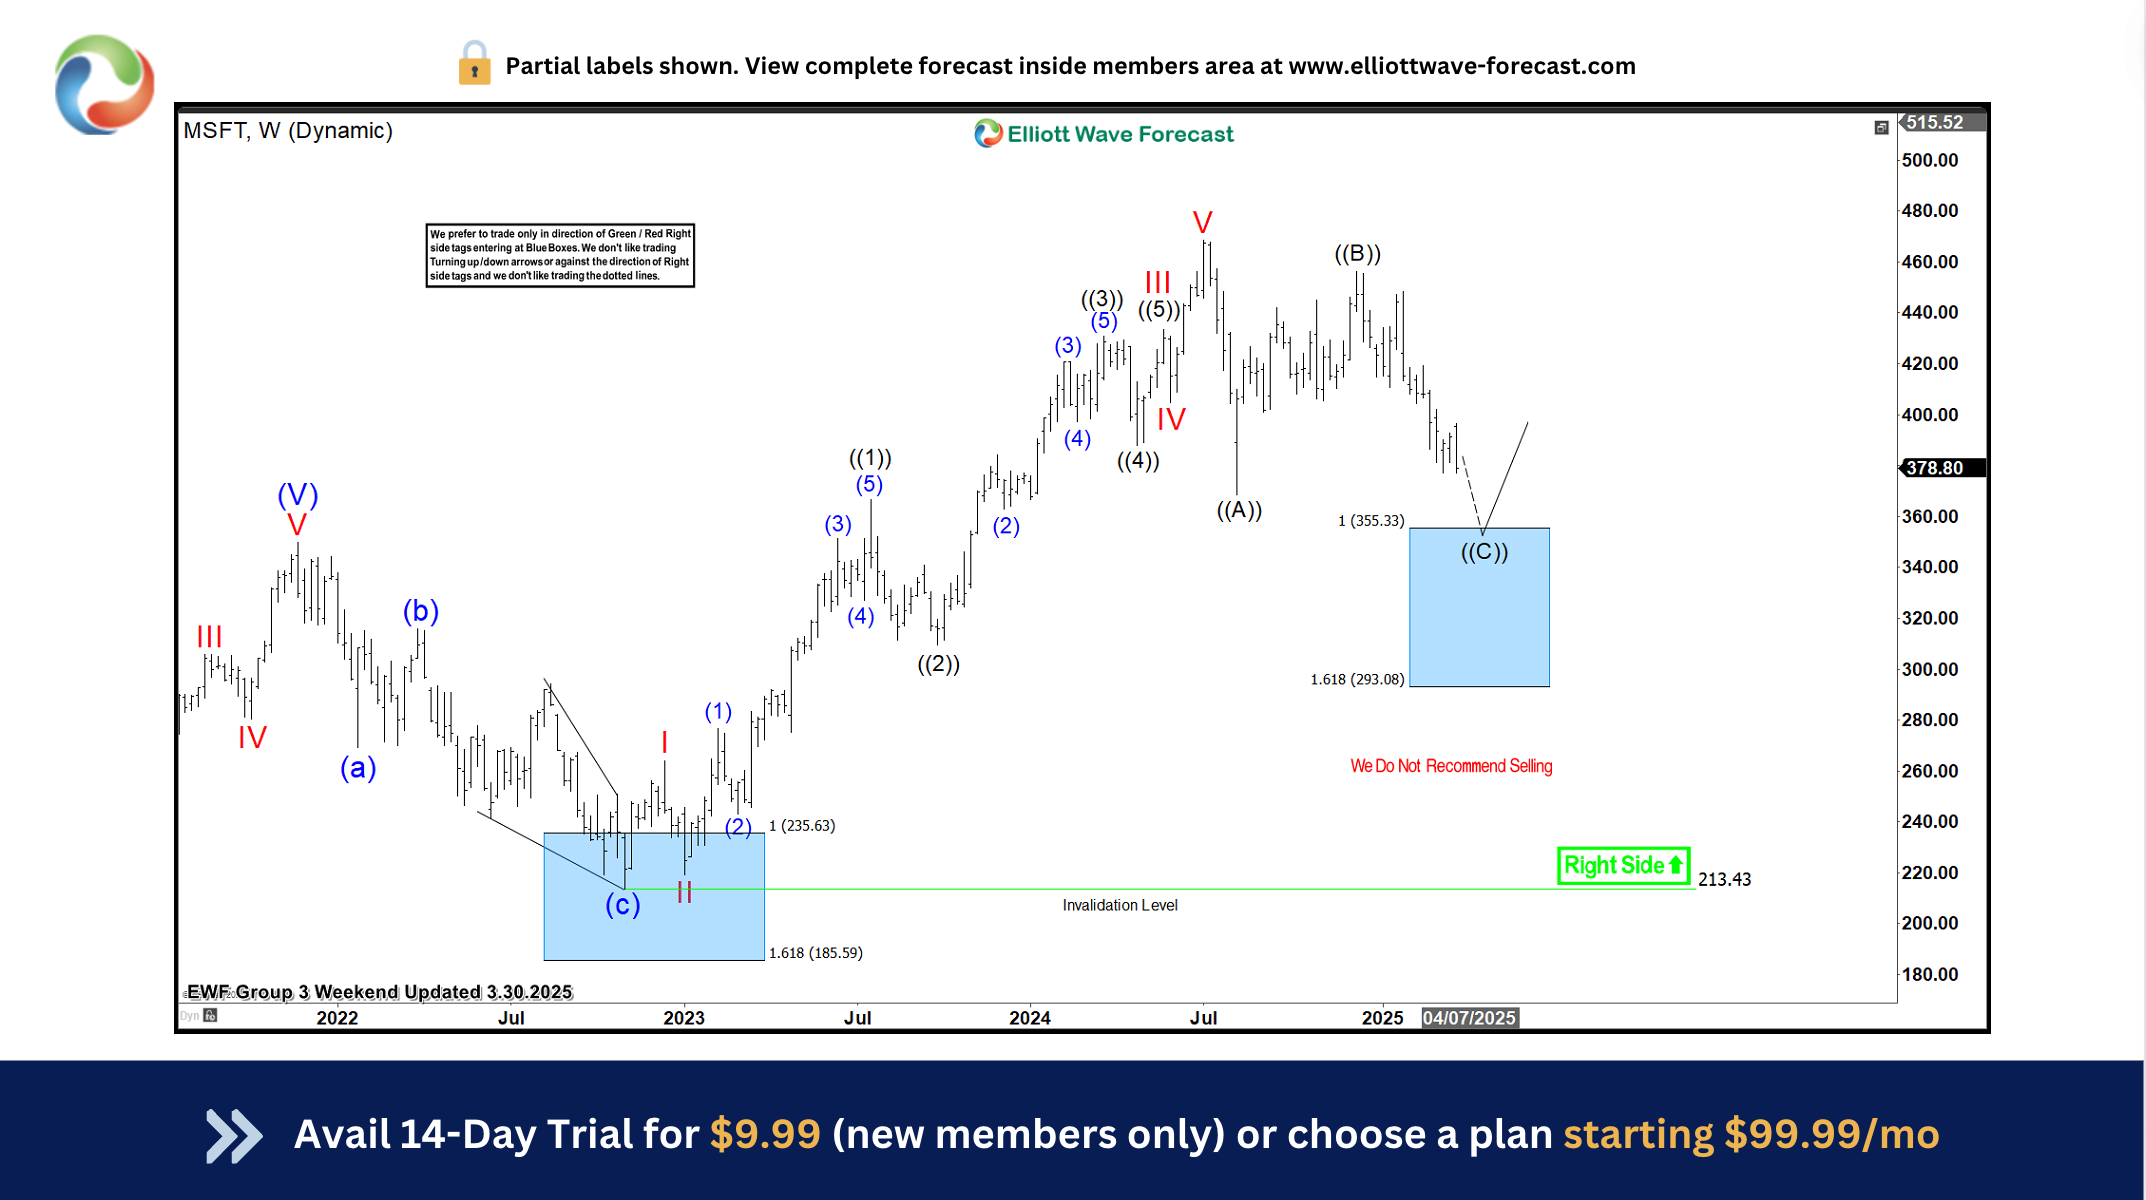 Our Elliott Wave analysis has consistently provided a clear roadmap for $MSFT’s trajectory. On March 30, 2025, our weekly chart showed something key. $MSFT finished a big 5-wave cycle from its October 2022 low. This strong upward push meant a pullback was due. We expected this pullback to be in 3 swings. This is a common Elliott Wave correction (ABC). We thought buyers would step in. The “blue box” area was our target. This was between $355.33 and $293.08. This area often signals a price reversal.
$MSFT Weekly Elliott Wave Chart 6.29.2025:
 Fast forward three months to our latest weekly update from June 29, 2025, and the charts tell a compelling story. Microsoft ($MSFT) bounced right from that “blue box.” This wasn’t a small bounce. It was a huge rally, up about 45%! The stock hit new all-time highs. It also reached our first goal: $500. Right now, the stock is still climbing. It is in what we call wave (3) of wave ((1)). This means more gains are likely. We think $MSFT could reach $510–$520 next. After that, we might see another pullback.
Conclusion
In conclusion, our Elliott Wave analysis of Microsoft Corp. ($MSFT) continues to prove accurate, suggesting that the stock remains well-supported against its April 2025 lows. For traders who capitalized on the entry opportunities presented in the “blue box” area, the $510–$520 zone should be closely monitored as the next significant objective. In the interim, keeping a vigilant eye out for any healthy corrective pullbacks could present fresh entry opportunities for those looking to join the trend. By applying the principles of Elliott Wave Theory, traders can gain a deeper understanding of market cycles, better anticipate the structure of upcoming moves, and ultimately enhance their risk management strategies in dynamic markets like the current one for $MSFT.
$MSFT Elliott Wave Video Analysis
Elliott Wave Forecast
We cover 78 instruments, but not every chart is a trading recommendation. We present Official Trading Recommendations in the Live Trading Room. If not a member yet, Sign Up for 14 days Trial now and get access to new trading opportunities. Welcome to Elliott Wave Forecast!
The post Microsoft $MSFT Soars 45% from Blue Box Area, Reaching Initial $500 Target appeared first on Elliott wave Forecast.