

The Home Depot (HD) stock prices are correcting the long term bullish trend. This could provide buyers will an opportunity in the coming days. This blog post will discuss the key price levels that should interest buyers from the Elliott wave perspective. The Home Depot, Inc. leads the home improvement market, selling tools, appliances, and services. Founded in 1978, it runs over 2,300 stores in North America, prioritizing customer service, innovation, and sustainability. The stock went public in the early ‘80s and remains highly profitable. The price is rallying within an all-time bullish cycle from 1981. Buyers have taken several opportunities from the dip. Meanwhile, despite coming from a record high in November 2024, buyers should continue to dominate. Thus, we do not recommend selling this stock. From the all-time low, $HD completed the first impulse wave – the grand-supercycle degree wave ((I)) in September 1983. It closed wave ((I)) at around 70 cents. Afterwards, a pullback followed for wave ((II)) to 23 cents. Wave ((II)) was completed in November 1985. Expectedly, wave ((III)) followed with a massive rally to close around $70 in March 2000. The wave ((IV)) pullback finished around $17 in October 2008. From October 2008, wave ((V)) emerged. Meanwhile, waves I, II, III, IV have all completed while V of ((V)) emerged from June 2022. Thus, the long-term impulse cycle from the all-time low may soon be over. However, wave V of ((V)) appears not have finished. Thus, buyers can still buy from the pullbacks. Meanwhile, as we have often noticed, pullbacks appear as 3, 7 or 11 swings structures. In other words, pullbacks could be single, double or triple corrections. For this case, we will look at the possibilities of a single and a double correction. In addition, we will discuss how traders can take advantage of the current pullback.
Home Depot Elliott Wave Analysis – Single Correction Pullback Scenario

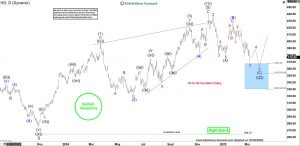
Home Depot Elliott Wave Analysis – Double Correction Pullback Scenario

About Elliott Wave Forecast
At www.elliottwave-forecast.com, we update one-hour charts four times daily and four-hour charts once daily for all 78 instruments. We also conduct daily live sessions to guide clients on the right side of the market. Additionally, we have a chat room where moderators answer market-related questions. Experience our service with a 14-day trial for only $9.99. Cancel anytime by contacting us at support@elliottwave-forecast.com.
The post Home Depot (HD) Elliott Wave Forecast: Key Levels for Buyers appeared first on Elliott wave Forecast.