

In this technical article we’re going to take a quick look at the Elliott Wave charts of GOLD commodity ( XAUUSD ) , published in members area of the website. As our members are aware, XAUUSD recently completed a 3-wave recovery against the 2726.1 peak. The commodity found sellers right at the equal legs zone. Let’s dive deeper into our Elliott Wave forecast in this article.
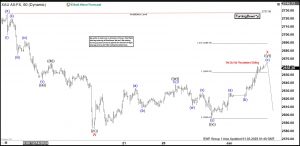
GOLD H1 Update 01.03.2025
According to the current analysis, GOLD seems to be in a red wave X recovery , correcting the cycle from the 2727.08 peak. The price has already reached the key zone at 2653.03 -2688.48. In this area, we expect sellers to take over. That could lead to further decline toward new lows or at least a 3-wave pullback. That’s why we don’t recommend buying this commodity right now. Reminder : You can learn more about Elliott Wave Patterns at our Free Elliott Wave Educational Web Page. 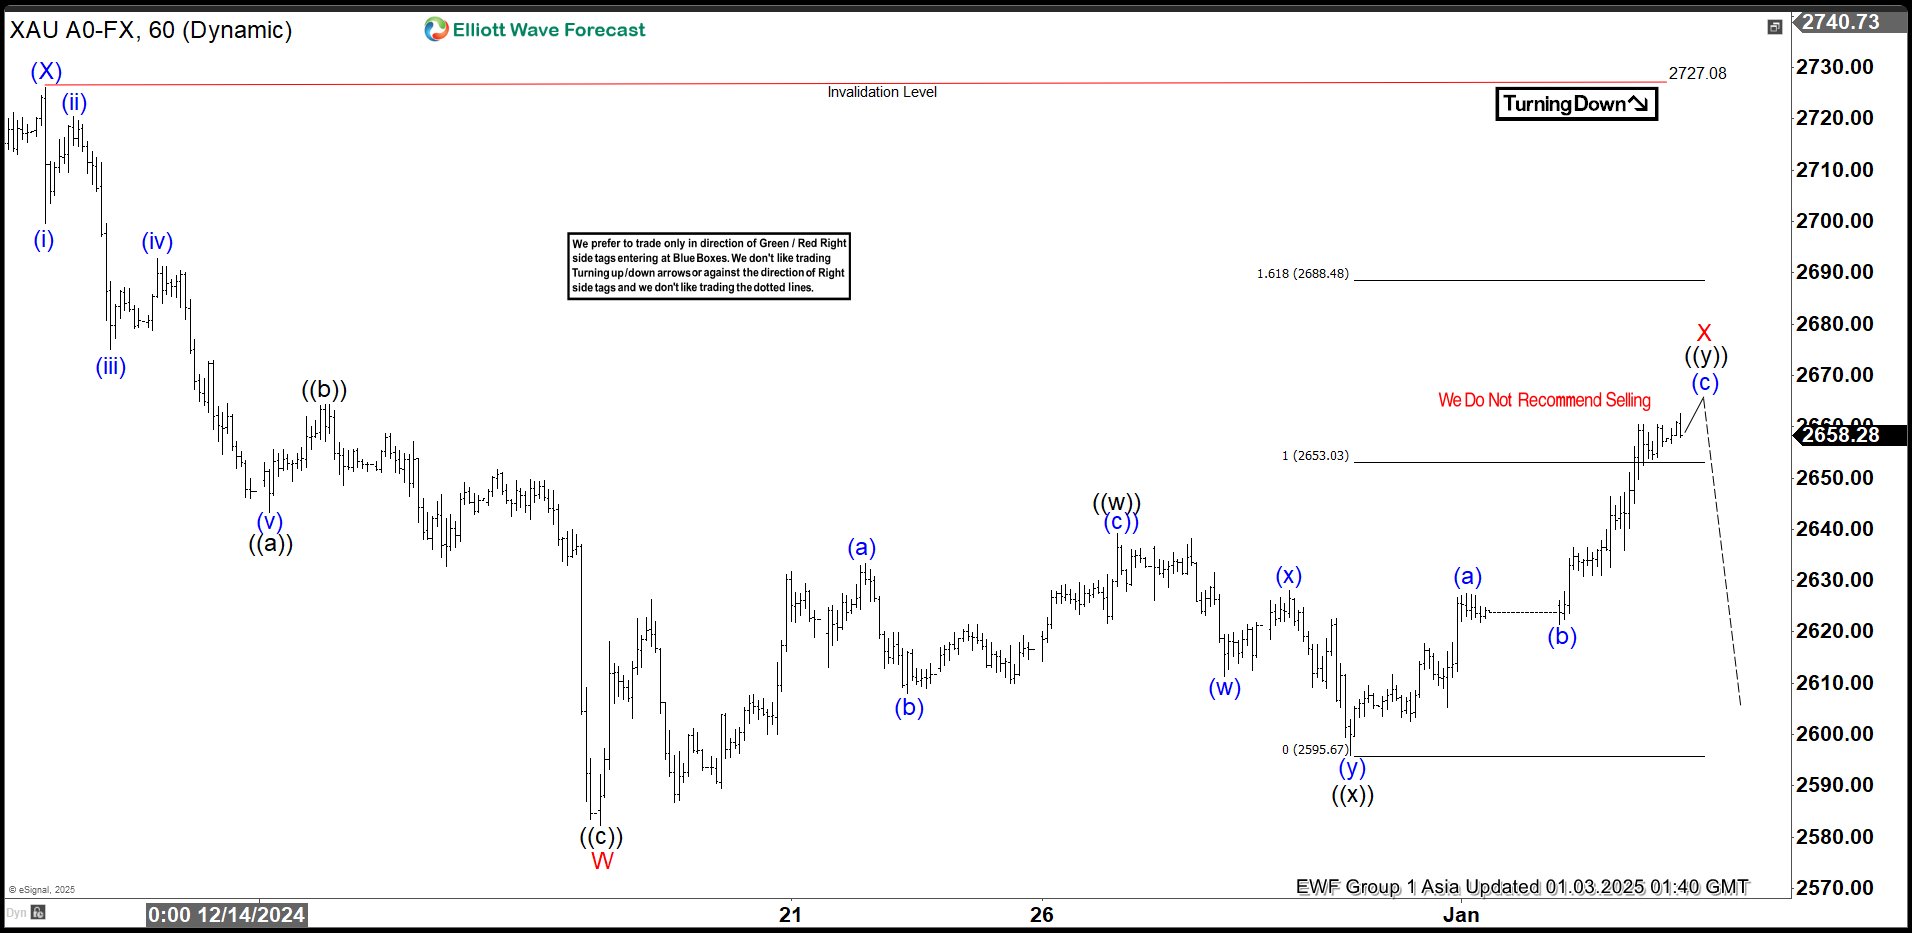
GOLD H1 Update 01.07.2025
GOLD found sellers at the Equal Legs Zone as anticipated. The commodity showed a significant reaction from the seller’s zone, and we consider the red wave X recovery to have ended at the 2665.42 high. As long as the price stays below this level, we expect further weakness in the red wave Y. A break below the red wave W low at 2583.8 is needed to confirm this scenario. However, if the price rises above the 2665.42 high, an alternative scenario will come into play. We do not recommend selling against the main bullish trend and will instead wait for the red wave Y as a potential buying opportunity if the next extreme zone is reached. You can find detailed information on this trading setup in the membership area and in the Live Trading Room 90% of traders fail because they don’t understand market patterns. Are you in the top 10%? Test yourself with this advanced Elliott Wave Test 

The post Gold (XAUUSD): Elliott Wave Analysis Predicts the Decline from Extreme Zone appeared first on Elliott wave Forecast.