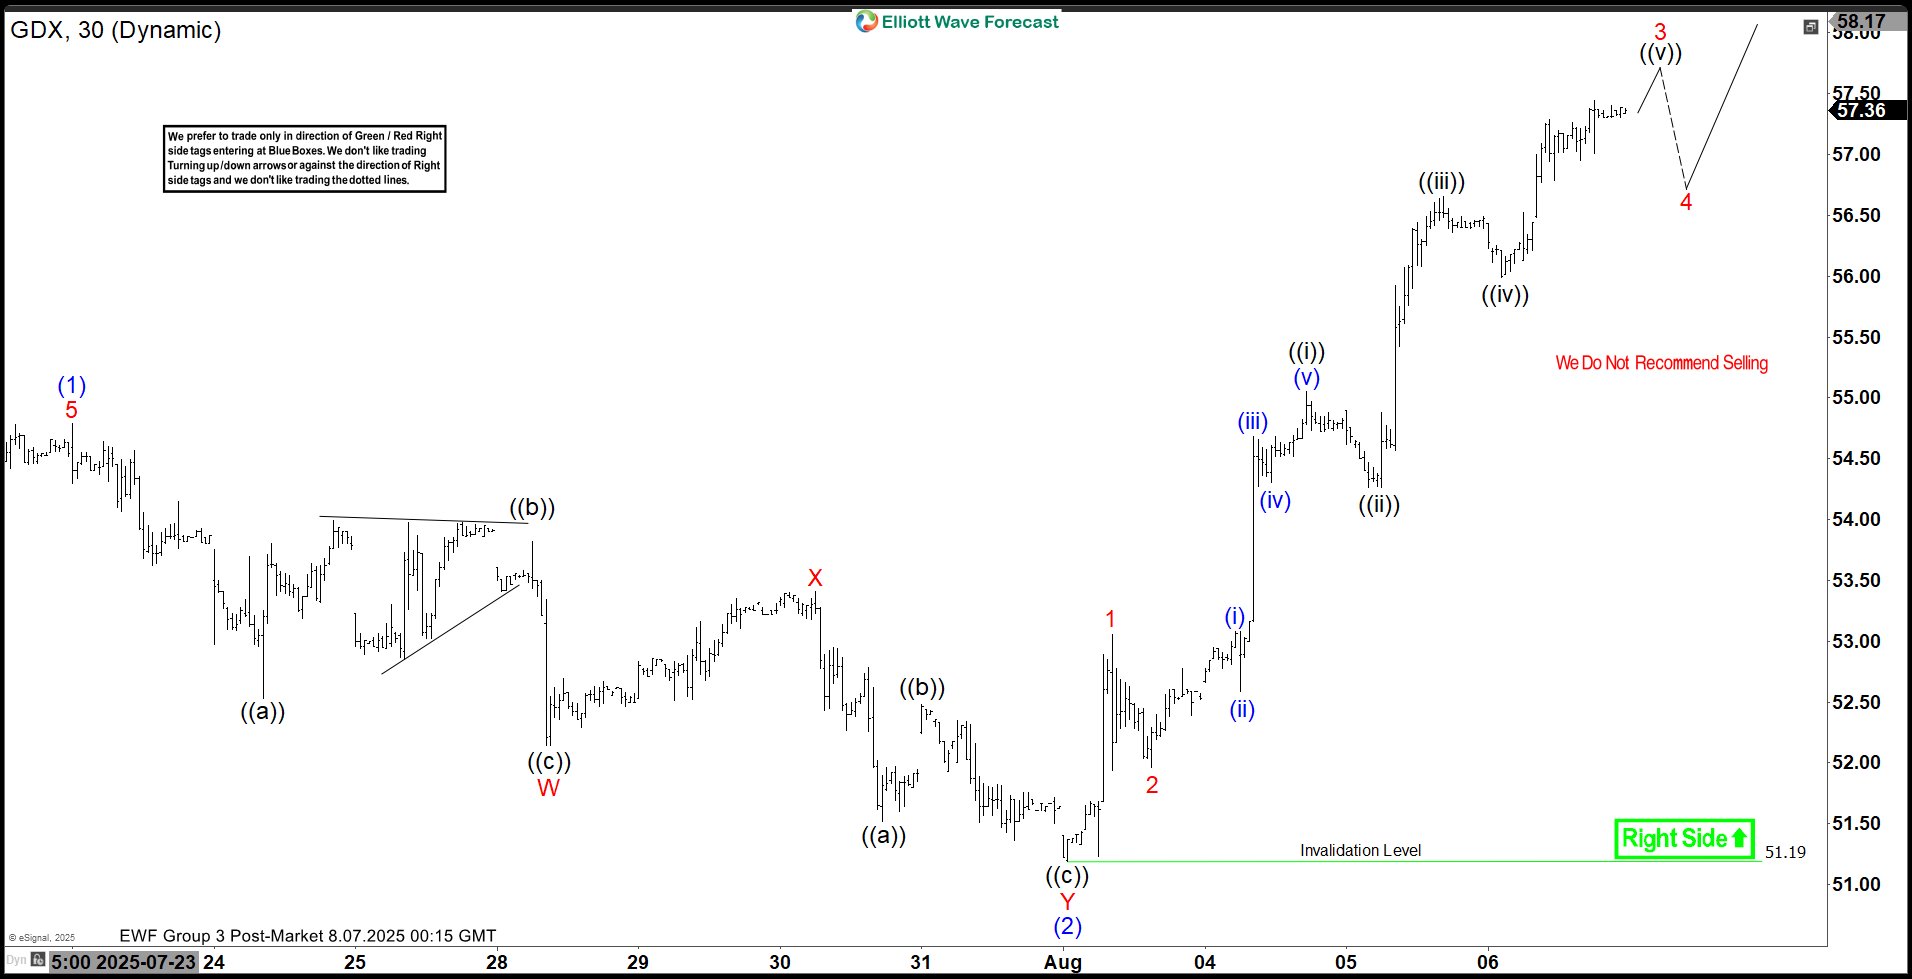
The Gold Miners ETF (GDX) continues its upward trajectory, forming a pattern of higher highs and higher lows since its September 2022 bottom, signaling a robust bullish market. From the July 17, 2025 low, GDX has embarked on a five-wave impulse Elliott Wave structure in the shorter cycle. The hourly chart shows wave (1) peaking at 54.79, followed by a wave (2) dip concluding at 51.19. Wave (2) unfolded as a double three Elliott Wave pattern, with wave W declining to 52.15, wave X rallying to 53.41, and wave Y completing the correction at 51.19. GDX has since surged within wave (3), structured as a lower-degree impulse. From wave (2), wave 1 climbed to 53.06, and a brief wave 2 pullback ended at 51.96. The ETF then advanced in wave 3, with sub-wave ((i)) reaching 55.05 and sub-wave ((ii)) retracing to 54.26. Sub-wave ((iii)) pushed higher to 56.66, followed by a sub-wave ((iv)) dip to 55.99. The ETF should soon complete sub-wave ((v)) of wave 3, followed by a wave 4 pullback before resuming upward in wave 5 of (3). As long as the 51.19 pivot holds, pullbacks should find support in a 3, 7, or 11-swing sequence, paving the way for further gains. The bullish momentum remains strong, with 58.3 as a potential target. Gold Miners ETF (GDX) – 60 Minute Elliott Wave Technical Chart:
GDX – Elliott Wave Technical Video:
The post GDX Elliott Wave Outlook: Strong Wave 3 Surge with $58 3 Target appeared first on Elliott wave Forecast.


