


The GBPJPY chart below shows the possible area where the pair can reverse lower from. Watch for possible reversal above the equilibrium level. There is a cluster of possible bearish zones of interest near the equilibrium level. There is a bearish supply zone (Blue) , bearish breaker block (Gray) and a bearish FVG (Green). All these bearish zones can trigger sellers/bears to enter the market and push the pair lower. ACTION: Traders should wait to see if price moves above equilibrium level first then look for sells with stop loss above the blue supply zone and targets at the range low and below. GBPJPY 1 Hour Chart September 21 2025 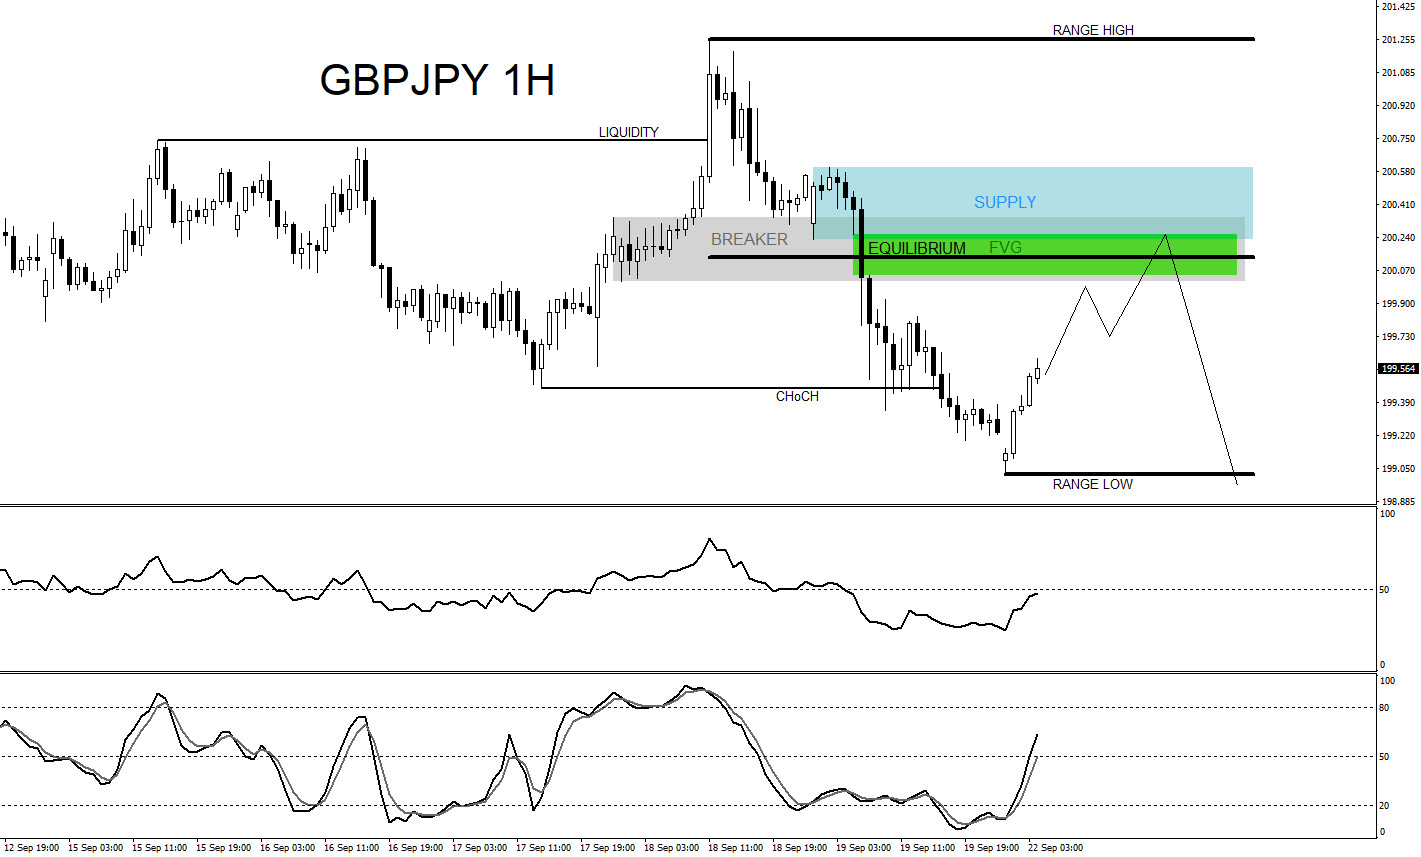 A trader should always have multiple strategies all lined up before entering a trade. Never trade off one simple strategy. When multiple strategies all line up it allows a trader to see a clearer trade setup. We at EWF never say we are always right. No market service provider can forecast markets with 100% accuracy. Only thing we at EWF 100%, is that we are RIGHT more than we are WRONG. Of course, like any strategy/technique, there will be times when the strategy/technique fails so proper money/risk management should always be used on every trade. Hope you enjoyed this article and follow me on social media for updates and questions> @AidanFX At Elliottwave-Forecast we cover 78 instruments (Forex, Commodities, Indices, Cryptos, Stocks and ETFs) in 4 different time frames and we offer 5 Live Session Webinars everyday. We do Daily Technical Videos, Elliott Wave Trade Setup Videos and we have a 24 Hour Chat Room. Our clients are always in the loop for the next market move. Try Elliottwave-Forecast for 14 days !!! Just click here –> 14 day trial
The post GBPJPY : Trade Setup for a Move Lower appeared first on Elliott Wave Forecast.