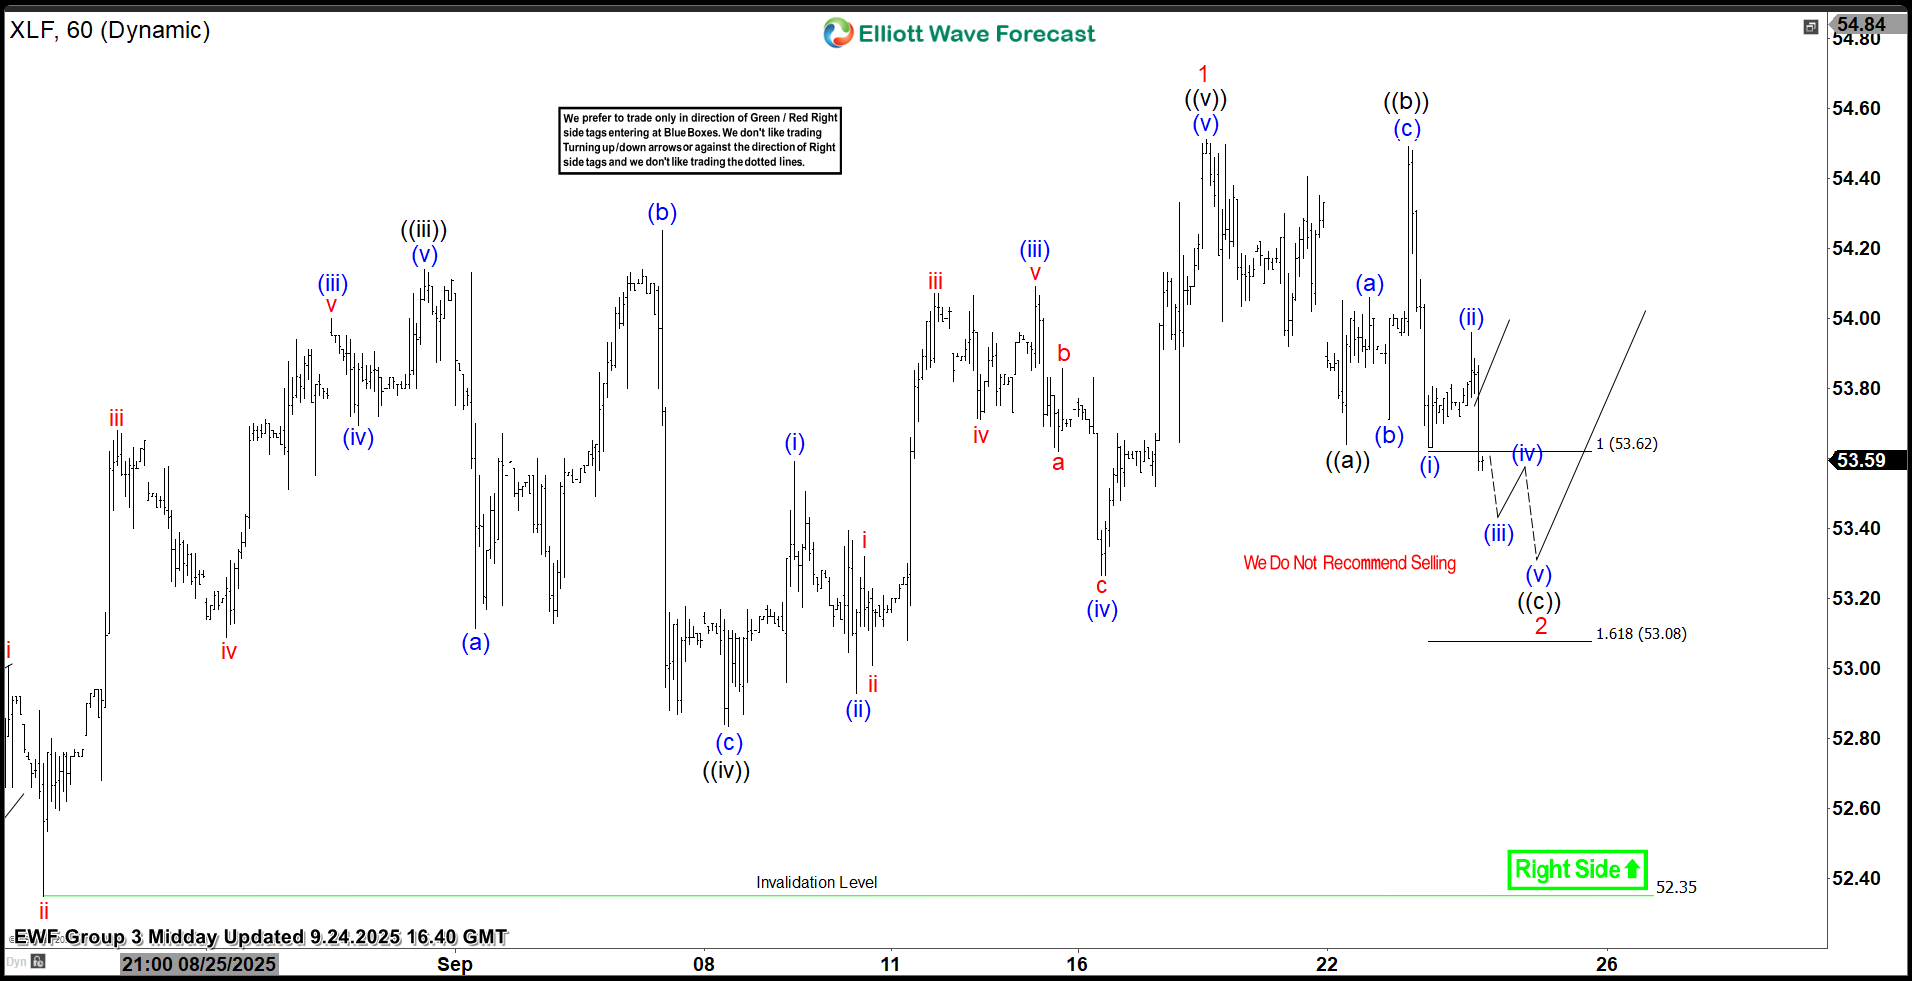
 In the 1-hour Elliott Wave count from Sep 24, 2025, we saw that $XLF completed a 5-wave impulsive cycle at red 1. As expected, this initial wave prompted a pullback. We anticipated this pullback to unfold in 3 swings, likely finding buyers in the equal legs area between $53.62 and $53.08. This setup aligns with a typical Elliott Wave correction pattern (ABC), in which the market pauses briefly before resuming its primary trend.
$XLF 1H Elliott Wave Chart 6.23.2025:
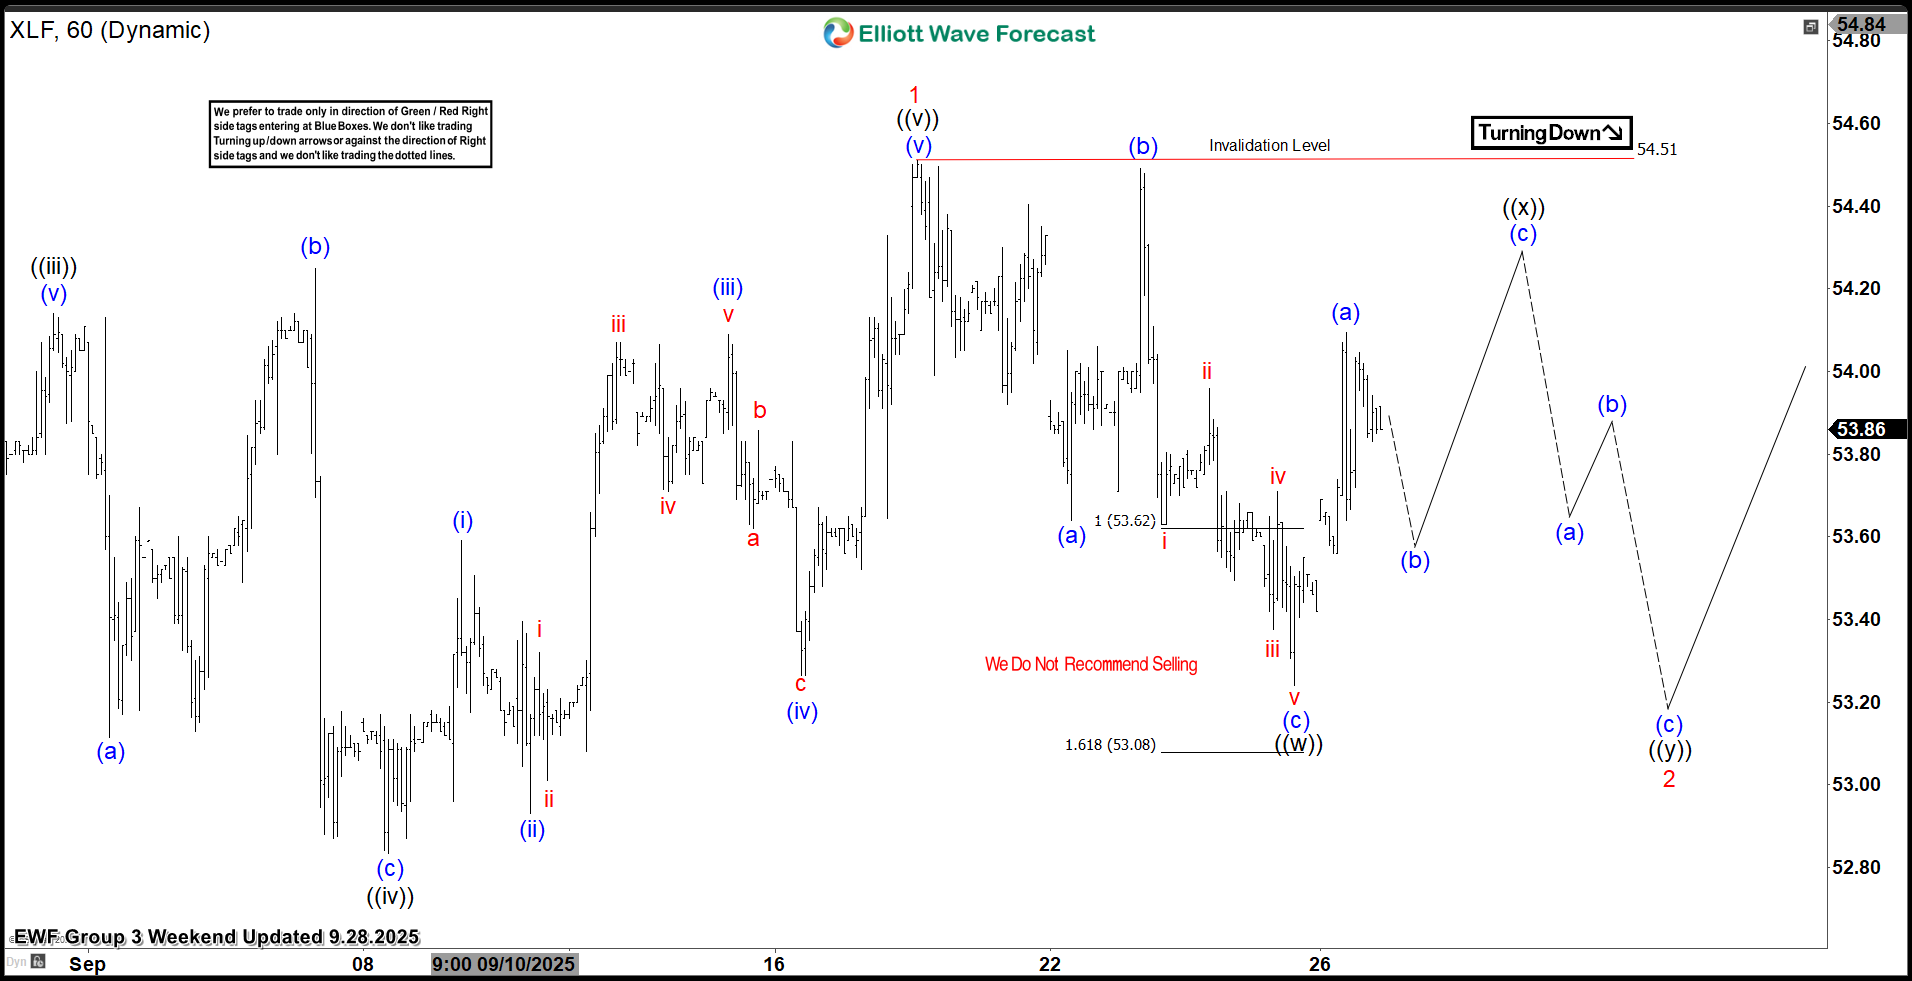 The weekend update, from Sep 28, 2025, shows that the ETF bounced as predicted allow longs to get risk free. Currently, it is trading higher in wave ((x)) connector before a double correction takes place. A break above 54.51 will open the next leg higher and negate any lower prices.
Conclusion
Elliott Wave Forecast
The post Financial Select Sector $XLF Extreme Areas Offering Buying Opportunities appeared first on Elliott Wave Forecast.

