Natural Gas has been showing some interesting price action lately, and for traders who use Elliott Wave analysis, the current setup is worth a closer look. The market has been moving through a double three correction characterized by a series of lower lows and lower highs. Both the daily and 4-hour charts suggest we might be approaching a turning point. Instead of guessing where price might go next, Elliott Wave helps us understand the structure behind the moves—giving us a clearer idea of what could be coming. In this post, we’ll break down what the wave counts are showing on both timeframes, highlight key levels for traders and highligh invalidaion level for the wave count. We will also explain why patience might be the smartest move right now. Let’s take a look at the charts and see what they’re telling us.
Natural Gas Daily Elliott Wave Analysis September 25, 2025
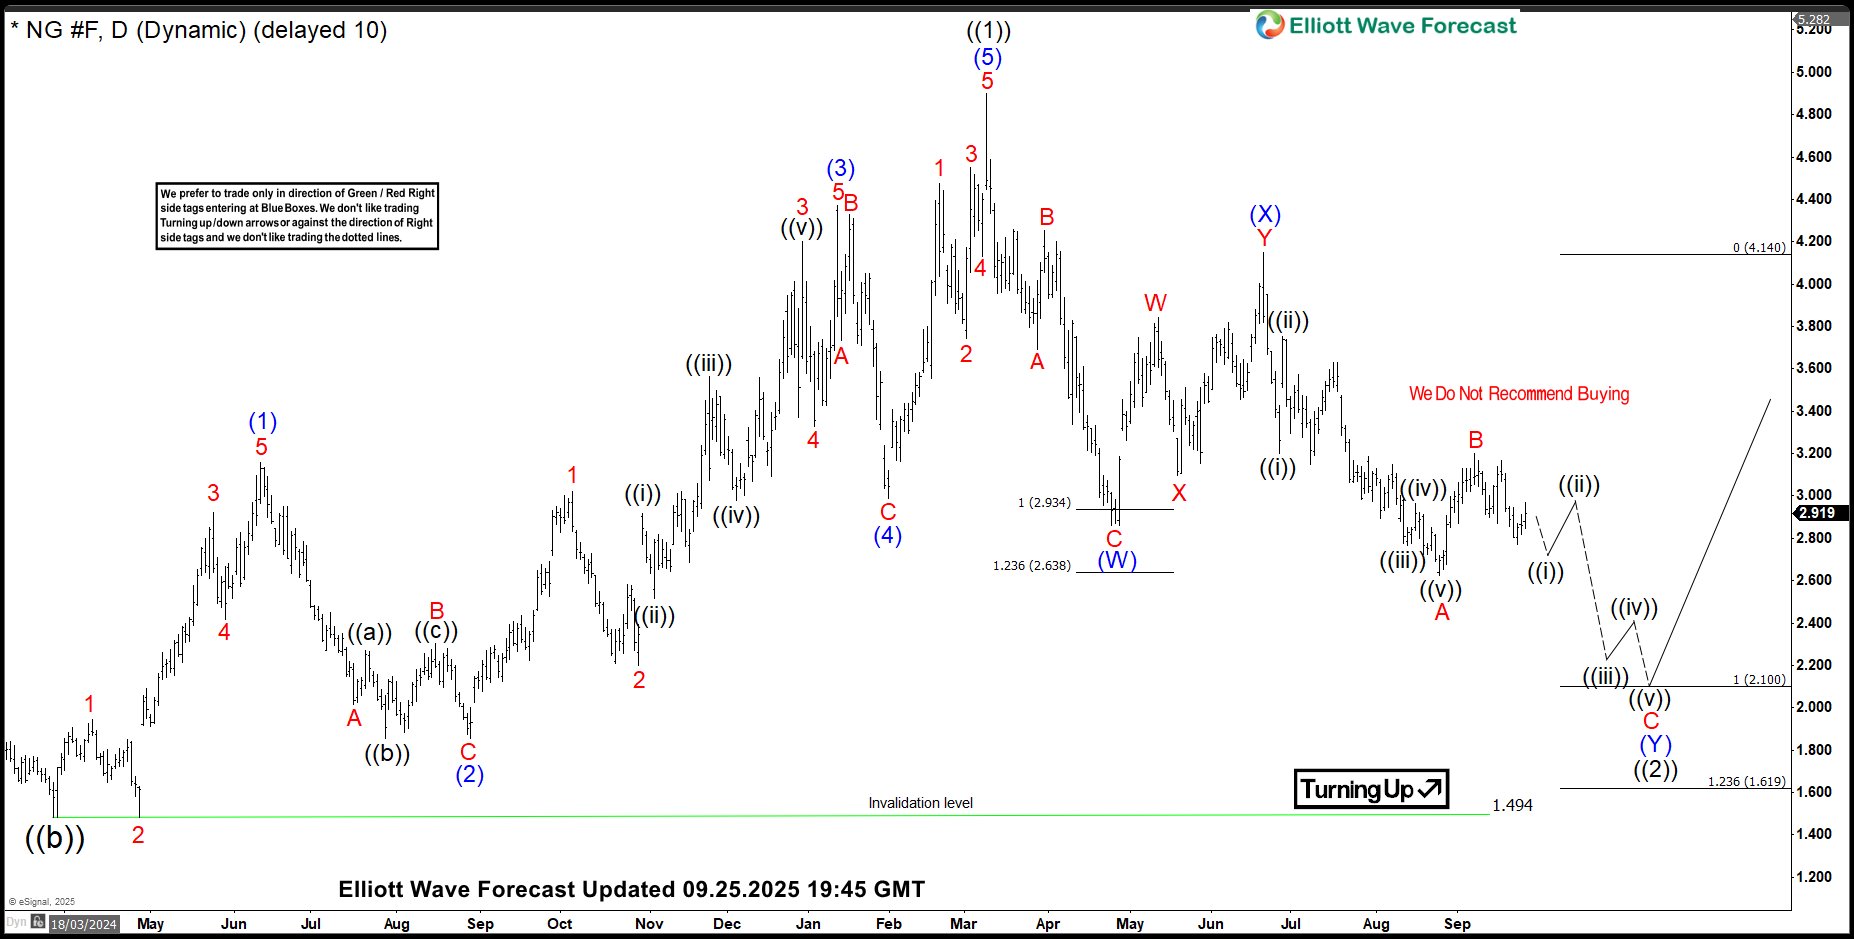
The chart below highlights a year-long rally in Natural Gas from the March 2024 low to the March 2025 peak, unfolding in a clear 5-wave impulsive structure. Within this move, we count 21 distinct swings, supported by momentum divergence between waves (3) and (5)—a classic sign of an impulse wave nearing completion. As per Elliott Wave guidelines, a 5-wave advance is typically followed by a corrective phase in 3, 7, or 11 swings. The initial pullback from the peak took the form of a Zigzag correction, bottoming at $2.967 on April 24, 2025. While this could have marked the end of the correction, the subsequent rally failed to hold, unfolding in just 3 waves and breaking below the $2.967 low on August 12. This breakdown created a 5-swing decline from the March 10 peak, which remains incomplete since corrective sequences unfold in 3, 7, or 11 swings. Based on this structure and the incomplete sequence, we anticipate one more swing lower toward the $2.100–$1.619 zone to complete the 7-swing correction. From there, Natural Gas could resume its larger bullish trend. A break below August 22 low ($2.622) is needed to confirm the last swing lower has started. Until then, a double correction higher in wave B can’t be ruled out [Ref alternate view below] Please note, a break below the March 2024 low at $1.494 would invalidate this outlook and suggest a deeper correction is underway. 
Natural Gas Daily Elliott Wave Analysis September 25, 2025 [ALT VIEW]
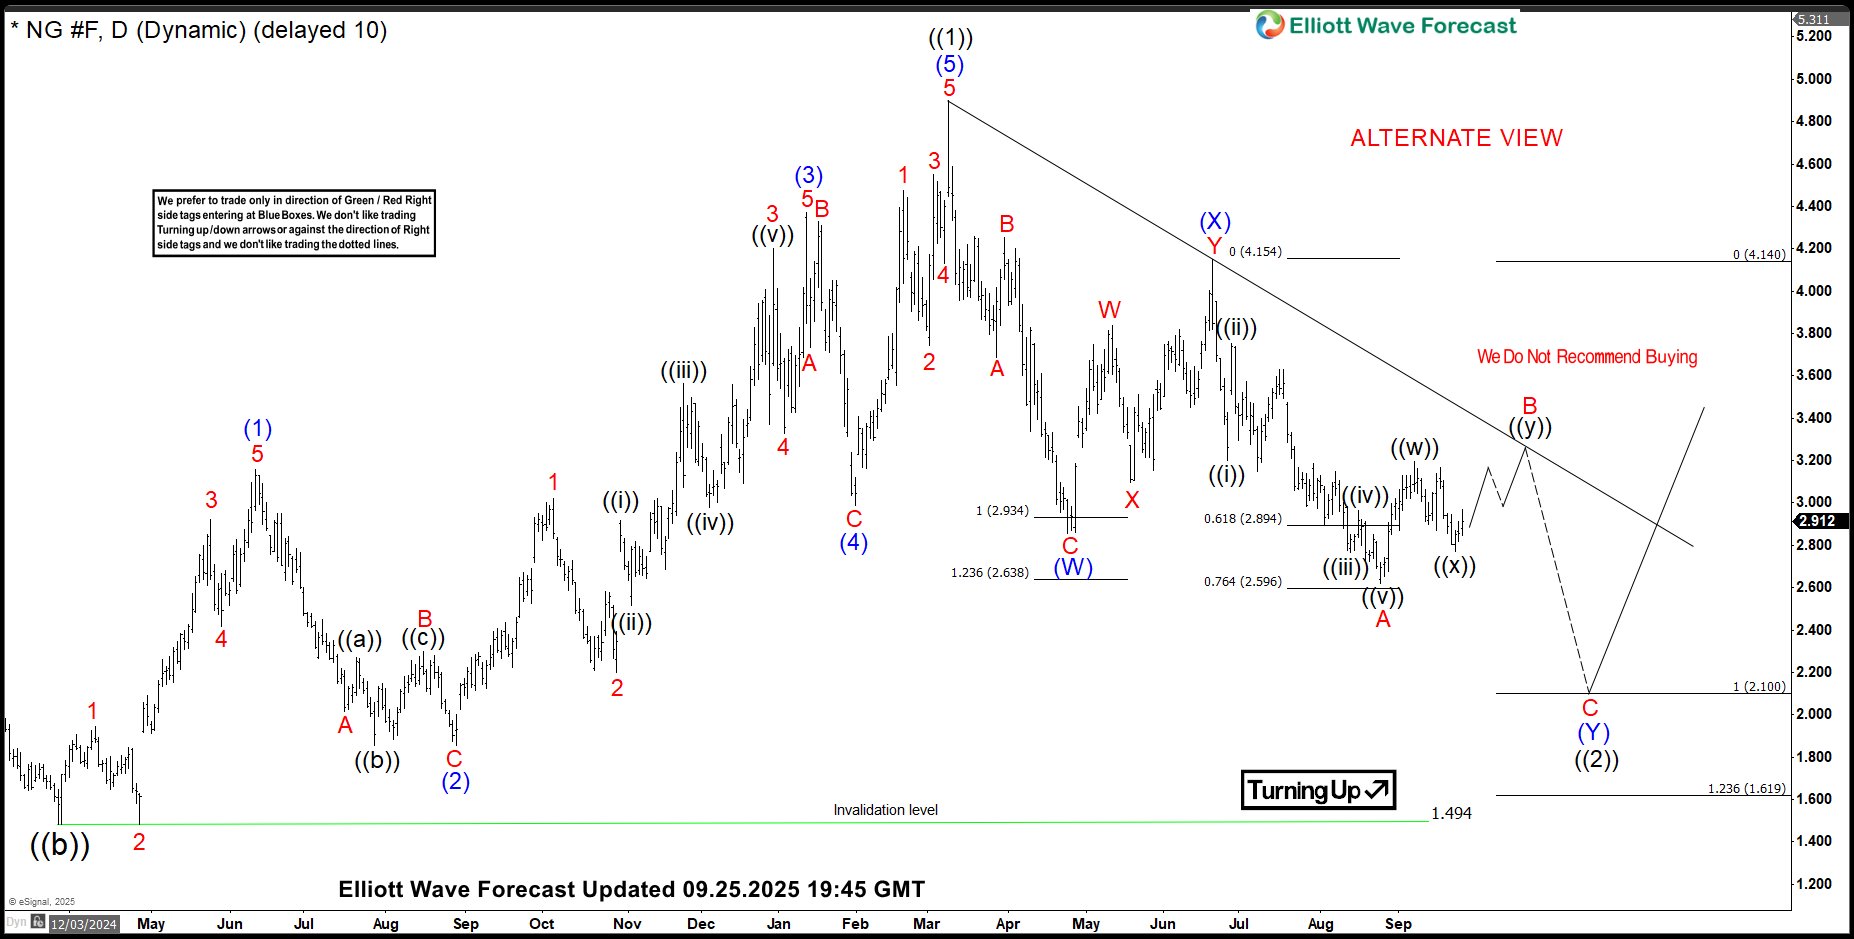
The chart below shows an alternate scenario where wave B is forming as a double correction. In this view, we expect one more push higher before the final move down begins. Price could retest the descending trend line, which connects the highs from March 10 and June 20, 2025. The zone between $3.342 and $3.478 represents the 100%–123.6% Fibonacci extension of wave ((w)) compared to wave ((x)). This is a typical area where wave ((y)) could complete. If price reaches this zone and starts to turn lower, it may confirm the end of the correction and signal the next leg down. 
The post Elliott Wave: Natural Gas May Drop Further Before Buyers Step In appeared first on Elliott Wave Forecast.

