
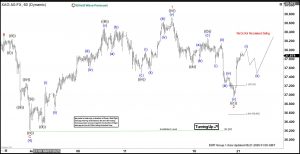

The bullish cycle in Silver (XAGUSD), initiated from the April 2025 low, continues to unfold as an impulse pattern. Starting from that low, wave (1) peaked at 33.68, followed by a corrective dip in wave (2) that concluded at 31.65. Silver then surged in wave (3) to 39.52, with a subsequent pullback in wave (4) finding support at 36.2, as illustrated on the 1-hour chart. Currently, wave (5) is developing as a lower-degree impulse. For the bullish trend to persist without risk of a double correction, Silver must break above 49.52. From the wave (4) low, wave ((i)) reached 36.8, and a brief pullback in wave ((ii)) stabilized at 36.34. The metal then climbed in wave ((iii)) to 38.5, followed by a correction in wave ((iv)) to 37.48. The final leg, wave ((v)), concluded at 38.73, completing wave 1 in a higher degree. A corrective wave 2 then unfolded as a zigzag Elliott Wave structure. From the wave 1 peak, wave ((a)) declined to 37.7, wave ((b)) rallied to 38.26, and wave ((c)) fell to 36.94, finalizing wave 2. Silver has now resumed its ascent in wave 3. As long as the 36.2 pivot holds, expect Silver to continue rallying. Silver (XAGUSD) – 60 Minute Elliott Wave Technical Chart:

XAGUSD – Elliott Wave Technical Video:
The post Elliott Wave Analysis: Silver (XAGUSD) Rallies Post Three Wave Pullback, Aiming for New Highs appeared first on Elliott wave Forecast.