
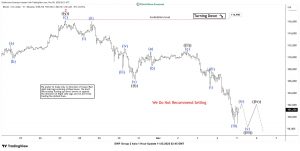

The short-term Elliott Wave outlook for Bitcoin (BTCUSD) indicates that the bearish cycle originating from the October 6, 2025 peak remains incomplete. Price action continues to unfold within an impulsive Elliott Wave structure, suggesting further downside potential. From the October 6 high, wave 1 concluded at $103,530, followed by a corrective rally in wave 2 that terminated at $116,400, as illustrated in the accompanying one-hour chart. Subsequently, Bitcoin extended its decline in wave 3, which itself subdivides into a smaller impulsive sequence. Within this leg, wave (i) ended at $113,487, and the corrective bounce in wave (ii) peaked at $116,077. The cryptocurrency then resumed its descent in wave (iii), reaching $107,948, followed by a brief recovery in wave (iv) to $111,603. The final push lower in wave (v) concluded at $106,313, thereby completing wave ((i)) of a higher degree. A corrective rebound in wave ((ii)) ensued, forming a zigzag structure that peaked at $111,129. From there, Bitcoin turned lower again in wave ((iii)). Within this leg, wave (i) ended at $105,300, and wave (ii) retraced to $107,707. The market has since resumed its decline in wave (iii), which has extended towards $98,898. Looking ahead, wave (iv) is expected to provide a corrective bounce, retracing part of the decline from the November 3 peak. However, the broader trend remains bearish. As long as the pivot at $116,400 remains intact, any rally is anticipated to fail in a 3, 7, or 11 swing sequence, paving the way for further downside to complete wave ((iii)).
Bitcoin (BTCUSD) Latest 60 Minutes Elliott Wave Chart From 11.05.2025 Post market
 BTCUSD Elliott Wave Video:
The post Elliott Wave Analysis: Bitcoin (BTCUSD) Bearish Pattern Signals Further Downside appeared first on Elliott Wave Forecast.