

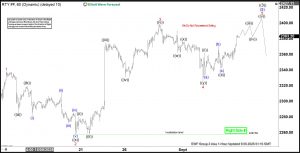
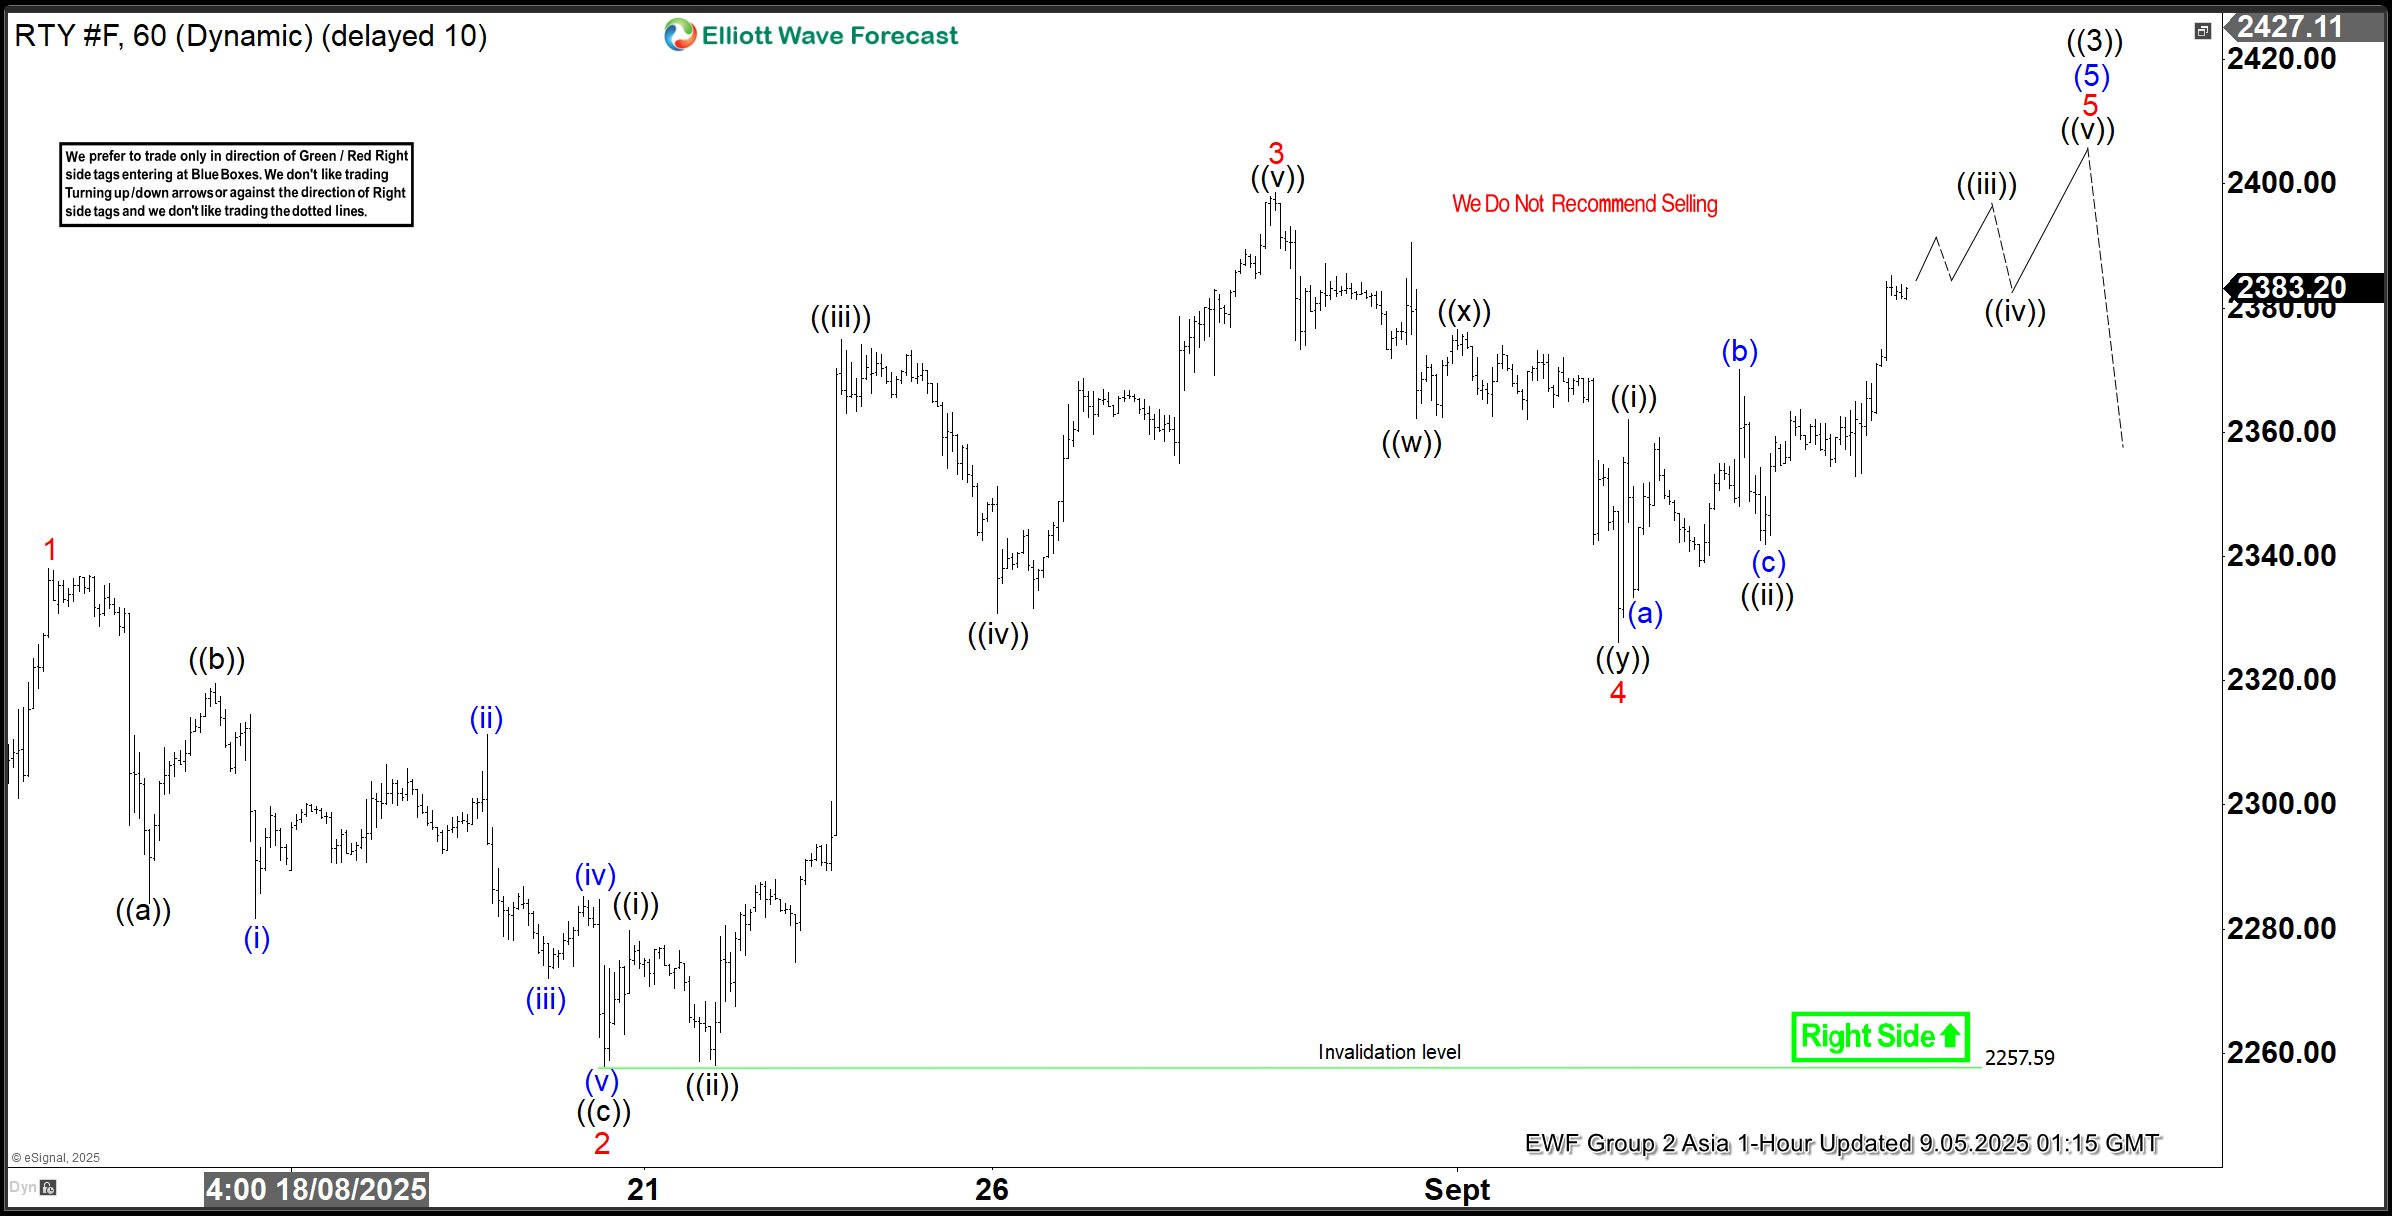
The short-term Elliott Wave analysis for E-Mini Russell 2000 Index Futures (RTY) indicates a rally from the August 1, 2025 low, unfolding as a diagonal pattern. Starting from that low, wave 1 peaked at 2338.1, followed by a wave 2 dip concluding at 2257.59. The Index then surged in wave 3, displaying an internal structure of five waves, as illustrated in the one-hour chart. From wave 2, wave ((i)) reached 2279.7, with a pullback in wave ((ii)) ending at 2258.10. The ascent continued with wave ((iii)) peaking at 2374.90, followed by a wave ((iv)) correction to 2330.80. The final leg, wave ((v)), concluded at 2398.6, completing wave 3 at a higher degree. Wave 4 unfolded as a double three Elliott Wave structure. From wave 3’s peak, wave ((w)) declined to 2362.2, and wave ((x)) rallied to 2376. Wave ((y)) then dropped to 2326.10, finalizing wave 4. The Index has since resumed its upward trajectory in wave 5. From wave 4’s low, wave ((i)) reached 2362, with wave ((ii)) correcting to 2341.90. In the near term, as long as the pivot low at 2257.59 holds, pullbacks should find support in a 3, 7, or 11 swing, paving the way for further upside. E-Mini Russell 200 Index Futures (RTY) – 60 Minute Elliott Wave Technical Chart:
 RTY – Elliott Wave Technical Video:
The post E-mini Russell 2000 Index Futures (RTY) Targets Wave 5 Diagonal appeared first on Elliott Wave Forecast.