

Hello fellow traders. In this technical article, we are going to present Elliott Wave charts of Dow Futures (YM_F) . As our members know, YM_F has been showing impulsive bullish sequences in the cycle from the August 43456 low, pointing to further strength ahead. We have been calling for a rally in Dow Futures. Recently we got an intraday pullback labeled wave ((iv)), which landed right in the equal‑legs zone. In the following section, we’ll explain our Elliott Wave count and present the target area for wave ((v))
YM_F Elliott Wave 1 Hour Chart 09.25.2025
Dow futures is currently doing wave ((iv)) black pull back. The correction appears incomplete at this stage. We anticipate further short-term weakness toward the Equal Legs area at 46271-45954 . In that zone, we expect buyers to emerge and initiate another rally toward new highs. Therefore, we recommend avoiding short positions within this area.
Nearly 90% of traders fail because they don’t understand how to read market patterns. Are you among the top 10% who do?
👉 Challenge yourself with this advanced Elliott Wave Test and find out.
Official trading strategy on How to trade 3, 7, or 11 swing and equal leg is explained in details in Educational Video, available for members viewing inside the membership area. 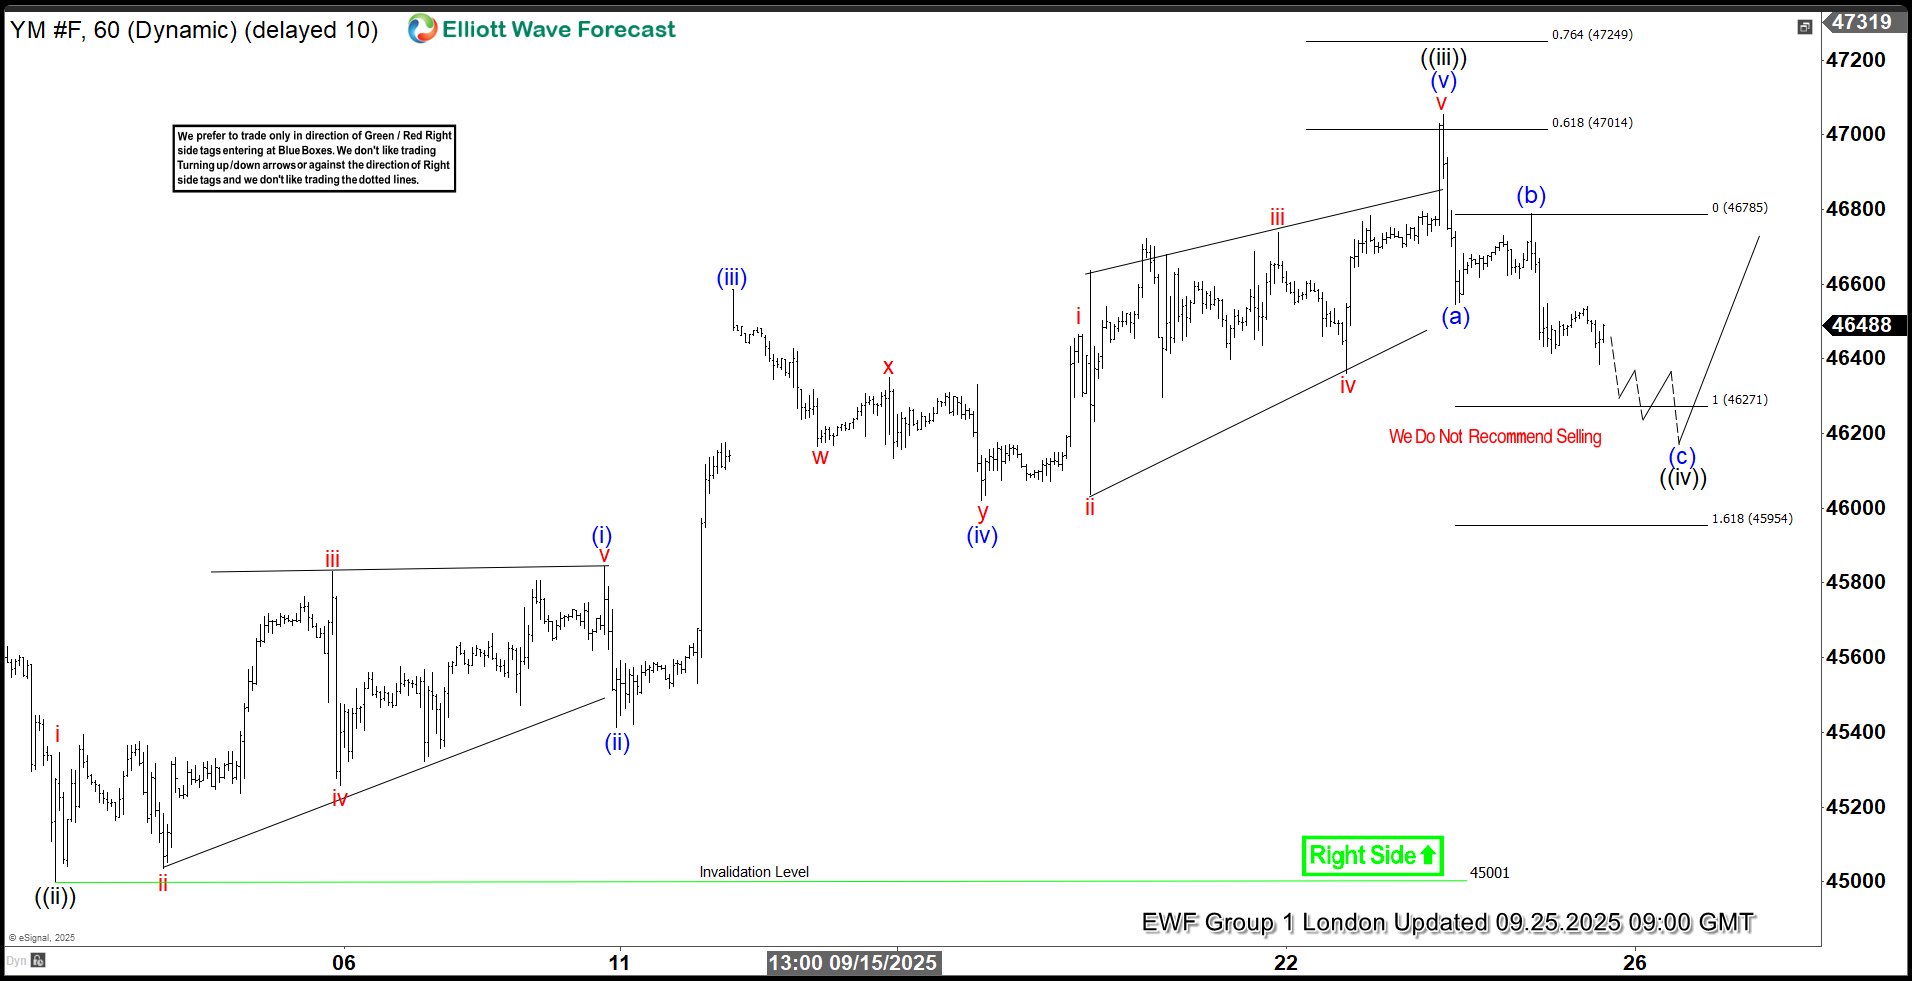
YM_F Elliott Wave 1 Hour Chart 10.02.2025
The price extended downward into the marked equal legs area, where YM_F found buyers as expected and has already shown a reaction. At this stage, we count the pullback as wave ((iv)), completed at the 46100 low. As long as price remains above that level, we are likely in wave ((v)), targeting the 47281-47646 zone. Alternatively, if the 46,100 low is broken before a new high is made, we’ll likely see a deeper pullback. In that case, we’ll measure a new equal-legs zone to identify the next buying area and update our members in the 24H chat room about it. Reminder for members: Please keep in mind that the market is dynamic, and the presented view may have changed in the meantime. Our chat rooms in the membership area are available 24 hours a day, providing expert insights on market trends and Elliott Wave analysis. Don’t hesitate to reach out with any questions about the market, Elliott Wave patterns, or technical analysis. We’re here to help. 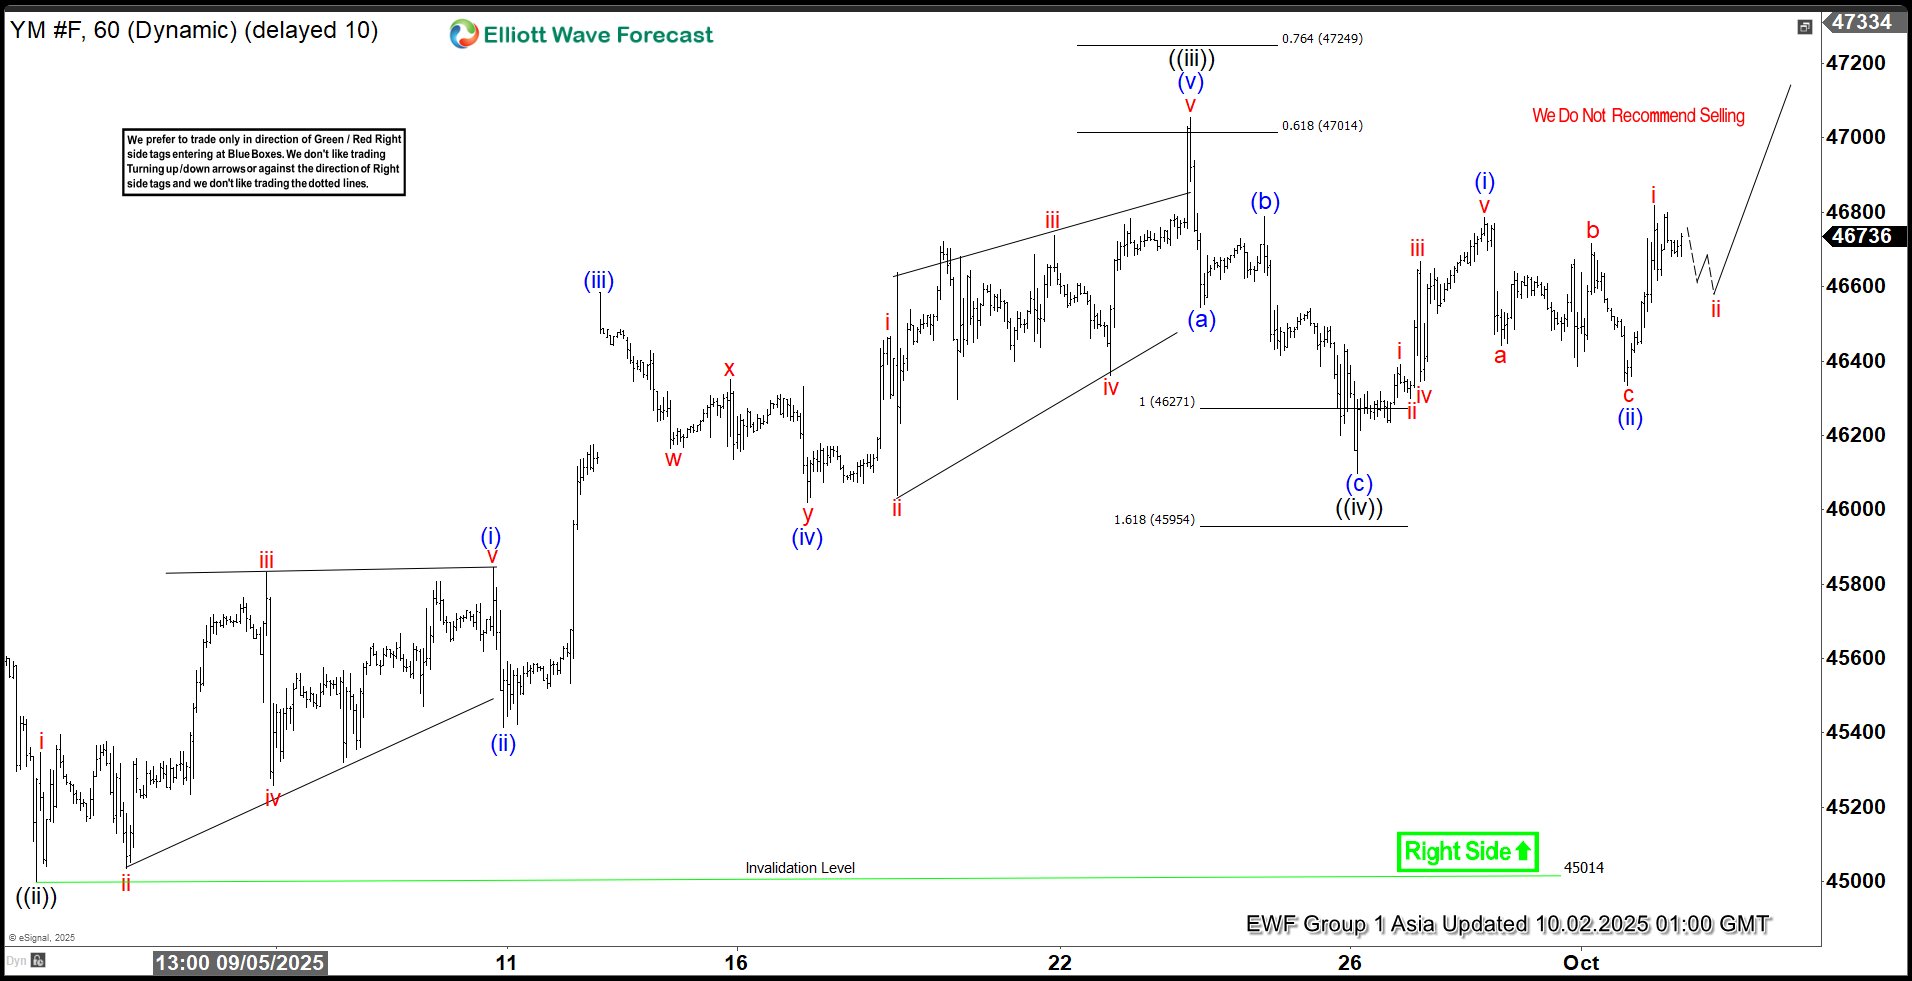
Elliott Wave Forecast
At Elliott Wave Forecast, we track and analyze 78 instruments daily — but remember, not every chart is a direct trading signal.
For real-time, actionable trades, join our Live Trading Room, where we guide you through clear, professional setups every day.
🚀 Not a member yet? Now’s the perfect time, we have Limited Time Promo Offer :
Unlock full access with our 14-day Trial for just $0.99!
Here’s what you’ll get:
✅ Official Trading Signals — with clearly defined Entry, Stop Loss, and Take Profit levels based on our proven strategy.
✅ Live 24 Hour Chat Room Access — ask unlimited questions and get expert support during trading hours (Monday–Friday).
✅ Expert Analysis — real-time updates across Forex, Stocks, Indices, Commodities, Cryptos, and ETFs.
✅ Hands-on Learning — sharpen your trading skills with direct mentorship from seasoned market analysts.
💬 Whether you’re an experienced trader or just getting started, Elliott Wave Forecast provides the tools, strategies, and support you need to trade with confidence.
Take the first step toward better, smarter trading 👉 Click here to start your Trial today!

The post Dow Futures (YM_F) Elliott Wave Calling the Rally After 3 Waves Pull Back appeared first on Elliott Wave Forecast.