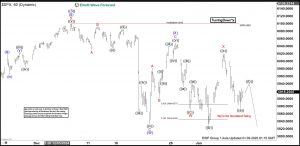
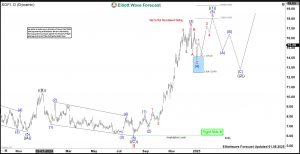
Short Term Elliott Wave view in S&P 500 (SPX) suggests the rally to 6099.6 ended wave ((3)). Pullback in wave ((4)) is currently in progress to correct cycle from December 22, 2022 low. Internal subdivision of the pullback is unfolding as a double three Elliott Wave structure. Down from wave ((3)), wave A ended at…
Categoria: Uncategorized
Rigetti Computing RGTI Ended a Cycle Looking for Support
In the last two days, RGTI has had a strong fall, losing more than 50% of its value. The stock ended a cycle and began a correction. Now we are going to see what could happen to the Quantum technology company, from where it can rebound and the pivots that will tell us if the…
AMD Bearish Setup From Blue Box Turns Risk-Free for Sellers
Hello traders. Welcome to another ‘blue box’ blog post where we discuss trade ideas that Elliottwave-Forecast members took. In this one, we will discuss a recent AMD sell setup from the blue box. Looking at the big picture, we saw that $AMD completed a long-term bullish cycle. This cycle began in July 2015 and ended…
Dollar Index (DXY) Forecasting the Rally After 3 Waves Pull Back
In this technical article we’re going to take a quick look at the Elliott Wave charts of Dollar Index DXY , published in members area of the website. As our members know, Dollar is still trading within the cycle from the September’s low. Recently, we saw a 3-wave pullback, followed by a solid rally as…
Gold (XAUUSD): Elliott Wave Analysis Predicts the Decline from Extreme Zone
In this technical article we’re going to take a quick look at the Elliott Wave charts of GOLD commodity ( XAUUSD ) , published in members area of the website. As our members are aware, XAUUSD recently completed a 3-wave recovery against the 2726.1 peak. The commodity found sellers right at the equal legs zone….
Elliott Wave View: Nasdaq (NQ) Looking for Further Correction Lower
Short Term Elliott Wave view in Nasdaq (NQ) suggests rally to 22454.7 ended wave ((3)). Pullback in wave ((4)) is now in progress as a zigzag Elliott Wave structure. Down from wave ((3)), wave 1 ended at 22206 and rally in wave 2 ended at 22387.75. The Index resumed lower in wave 3 towards 21311…
Hedera HBAR Looking To Break Above $0.4 in wave ((5))
Hedera is a decentralized, open-source, proof-of-stake public ledger and HBAR is the native cryptocurrency of the platform, used for processing and securing transactions on the network. HBAR daily chart is showing an impulsive 3 waves structure up from 2023, moreover, the recent rally in wave ((3)) was the strongest achieving +830%. Then It did pullback in 3…
SoFi Technologies (SOFI) Found Buyers To Extend Above $18
SoFi Technologies, Inc., (SOFI) provides various financial services in the US, Latin America & Canada. It operates through three segments; Lending, Technology Platform & Financial services. It is based in San Francisco, CA, comes under Financial Services sector & trades as “SOFI” ticker at Nasdaq. In last article, SOFI favored downside in C towards blue…
Uranium Miners ETF (URA) Has Turned Higher
The Global X Uranium ETF (URA) is designed to provide investors with exposure to the uranium mining industry. It includes companies involved in uranium mining, exploration, development, and production, as well as those producing nuclear components. With significant holdings in major uranium producers like Cameco, URA offers a way to invest in the nuclear energy…
USDCAD Moves Higher as Expected and Hits 4R Target
On December 31 2024 we called for USDCAD to make another move higher and showed our members the Elliott Wave bullish scenario. The wave count below signalled to our members that the pair would move higher during the trading week into 2025. USDCAD 1 Hour Midday Update December 31 2024 The Elliott Wave count confirmed…