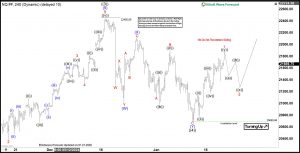
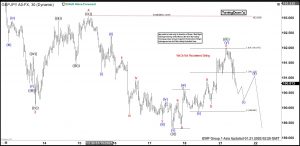
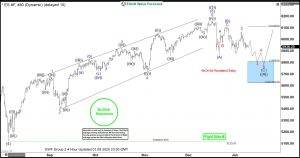
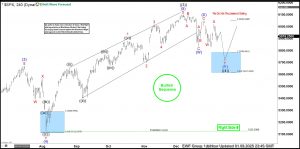
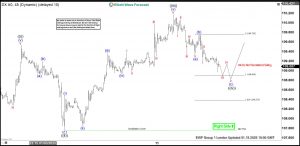
NASDAQ E-Mini Futures (NQ) appears to be extending the bullish sequence from October 2022. Will the sequence finish soon and lead to a big sell-off across the US indices? While the sequence persists, where should traders eye the next opportunity? The NQ chart is very clear. After the markets recovered from Covid in March/April 2020,…
Categoria: Uncategorized
Uranium Miners ETF (URA) Looking to Resume Higher
The Global X Uranium ETF (URA) is an investment vehicle aimed at tracking a market-cap-weighted index of companies in the uranium mining and nuclear components sector. URA has gained attention due to the resurgence in nuclear energy demand, particularly from tech and AI sectors, with its performance recently showing strong recovery and volatility, reaching near…
BNB/USDT Elliott Wave Analysis: Wave ((5)) Unfolding with Bullish Potential
Elliott Wave Analysis for Binance Coin (BNB/USDT) This analysis examines Binance Coin (BNB/USDT) on the daily timeframe using Elliott Wave theory. The chart reveals a bullish trend, with the structure currently in wave ((5)), the final phase of a larger impulsive pattern. Wave ((3)) was completed earlier as a five-wave sequence. This confirmed strong upward momentum….
NU Holdings (NU) Favors Corrective Bounce Before Lower
NU Holdings Ltd., (NU) provides digital banking platform in Brazil, Mexico, Colombia, Germany, Argentina, United States & Uruguay. It offers spending solutions comprising credit & prepaid cards, mobile payment solutions & integrated mall that enables customers to purchase goods & services from various ecommerce retailers. It comes under Financial services sector & trades as “NU”…
Elliott Wave View on GBPJPY Looking to Extend Lower in Wave 5
Short Term Elliott Wave view in GBPJPY shows the decline from 12.30.2024 high is in progress as a 5 waves impulse. Down from 12.30.2024 high, wave 1 ended at 195.72 and wave 2 rally ended at 198.25. Pair has resumed lower in wave 3 towards 190.06 as the 30 minutes chart below shows. Wave 4…
S&P 500 E-Mini (ES_F) Elliott Wave: Buying the Dips at Blue Box
Hello fellow traders, As our members know we have had many profitable trading setups in Indies recently. In this technical article, we are going to present another Elliott Wave trading setup we got in SPX E-Mini ( ES_F ) . ES_F completed this correction precisely at the Equal Legs zone, referred to as the Blue…
SPX Perfectly Reacting Higher From The Blue Box Area
In this technical blog, we will look at the past performance of the 4-hour Elliott Wave Charts of SPX. We presented to members at the elliottwave-forecast. In which, the rally from the October 2022 low unfolding as an impulse structure. Also showed a higher high sequence with a bullish sequence stamp. Suggested that index should see more…
Dollar Index (DXY) Elliott Wave Calling The path
In this technical article we’re going to take a quick look at the Elliott Wave charts of Dollar Index (DXY) published in members area of the website. As our members are aware, the DXY is currently showing impulsive bullish sequences in the cycle from the September low. As a result, we are leaning towards the…
Elliott Wave View Looking for NZDUSD to Extend Lower
Short Term Elliott Wave view in NZDUSD suggests that cycle from 9.30.2024 high is in progress as an impulse. Down from 9.30.2024 high, wave (1) ended at 0.5813 and wave (2) ended at 0.5929. Pair has resumed lower in wave (3) which ended at 0.5583 as the 1 hour chart below shows. Rally in wave…
Will USDCAD Rally Higher?
Before the start of the January 13 2025 trading week we called for USDCAD to make a move lower first and terminate the wave ((ii)) which will then be followed by a rally higher. The Elliott Wave chart below advises to our members to watch for buying opportunities once the wave ((ii)) terminates with 1.4276…