Michael Saylor’s Strategy continued its acquisition of Bitcoin (BTC) on Monday by purchasing $26 million worth of the cryptocurrency, according to a new filing by the company with the United States Securities and Exchange Commission (SEC). Michael Saylor’s Strategy Purchases Millions in Latest Bitcoin Buy According to the June 23 filing, Strategy announced its acquisition…
Categoria: Uncategorized
Trezor Issues ‘Urgent Alert’ After Support-Form Exploit Sends Phishing Emails – What Users Must Know
Trezor has issued a high-priority security warning after attackers exploited its support contact form to send phishing emails to users. The company confirmed that scammers submitted fake support requests using email addresses associated with real users, prompting the system to send out automated replies that mimicked legitimate Trezor support messages. Important Update We have identified…
JUP Holders Panic Sell After 80% Crash – Dead or Buying Opportunity?
Jupiter (JUP), the leading Solana-based decentralized exchange (DEX) aggregator, has experienced a devastating market crash as investor confidence appears to have evaporated completely. Following its last venture above $1 in February, the JUP token has maintained a relentless bearish trajectory, shedding over 33% in the past month alone and plummeting 82.73% from its post-launch peak…
$100 Million BNB Bet: Nasdaq Company Mirrors MicroStrategy’s Playbook in Bold Treasury Move
Key Takeaways: A team of former Coral Capital executives is raising $100 million to purchase BNB through a public company. The firm will be renamed Build & Build Corporation and hold BNB as a treasury asset. Binance continues to lead altcoin and stablecoin deposit activity on Ethereum and TRON. A team of hedge fund executives…
Bitcoin ASIC Manufacturer Canaan Drops AI Chips, Bets Big on U.S. Bitcoin Mining – Here’s Why
Canaan, the Singapore-based manufacturer of Bitcoin ASIC machines, is exiting the artificial intelligence chip market to concentrate on its core business in crypto infrastructure. The company announced Monday that it has officially shut down its AI semiconductor unit and completed a pilot production run of mining rigs in the United States. The move marks a…
Strait of Hormuz Risk Escalates – BTC Bull Token Offers Amplified Play on Bitcoin’s Safe Haven Appeal, Final Week of Presale
Rising geopolitical tensions in the Middle East have intensified after Iran threatened to block the Strait of Hormuz following a U.S. surprise strike on three Iranian nuclear sites – a move that could disrupt the global oil supply and ignite financial market turmoil. Historically, oil shocks tend to send capital flowing into safe haven assets….
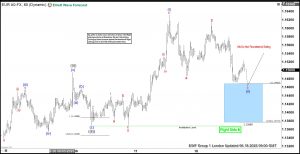
EURUSD Trade Setup Explained: Buying the Dips at the Blue Box Zone
Hello fellow traders. In this technical article, we are going to talk about another Elliott Wave trading setup we got in EURUSD . The pair has completed its correction exactly at the Equal Legs zone, also known as the Blue Box Area. In this article, we’ll break down the Elliott Wave Forecast and explain the…
Solaxy (SOLX) Price Set to Heat Up as Solana Layer 2 Lists on DEXs, Major Exchanges to Follow
New Solana Layer 2 Solaxy (SOLX) listed on DEXs today. SOLX can be bought on Uniswap and Raydium DEXs, among others, as the price gets ready to blast higher as excitement surrounding the pathbreaking scaling solution explodes. Available on both Ethereum and Solana chains, SOLX was one of the biggest ICOs of the year, attracting…
Hong Kong Sets High Bar for Stablecoin Issuers Ahead of August Regime Launch
Key Takeaways: Hong Kong’s licensing regime for stablecoin issuers begins on August 1, with limited approvals expected in the initial phase. Applicants must show detailed control systems, including asset security and AML compliance, and prove their ability to operate across jurisdictions. The HKMA references global regulatory frameworks, including FSB guidelines, to structure its supervisory approach….
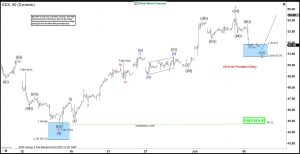
Gold Miners (GDX) Another Buying Opportunity at the Blue Box
As our members know we have had many profitable trading setups recently. In this technical article, we are going to present another Elliott Wave trading setup we got in Gold Miners ETF GDX . The ETF completed its correction precisely at the Equal Legs zone, referred to as the Blue Box Area. In the following sections,…


