The US Federal Housing Finance Agency (FHFA) may soon explore the role of crypto holdings in mortgage qualification, according to a statement from its director, Bill Pulte. Key Takeaways: The FHFA is considering whether crypto holdings could factor into mortgage eligibility. Director Bill Pulte, a vocal crypto supporter, holds significant stakes in Bitcoin and Solana….
Categoria: Uncategorized
Expert Reveals Why ETH Can Hit Record High This Year, and Whether Altseasons Are Over
Bitcoin and major cryptocurrencies have witnessed a healthy rebound after Donald Trump declared a ceasefire between Israel and Iran has come into force. The president’s announcement on Truth Social was unlikely to say the least, as it came hours after Tehran fired missiles at a U.S. base in Qatar. Despite a night of confusion —…
Telegram Shuts Down Huione’s Largest Crypto Scam Market Ever, But Rivals Take Over with 400% Volume Surge
Telegram shutting down Huione Guarantee, the largest illicit marketplace in history, with over $27 billion in transactions, paradoxically strengthened the dark market as rival platforms experienced a 400% volume surge and quickly absorbed the criminal user base. Following blockchain analytics firm Elliptic’s investigation, Telegram banned thousands of channels and accounts linked to Huione on May…
$4B Hong Kong Family Office Enters Crypto — How Big is the Bet?
VMS Group, a Hong Kong multifamily offices with deep roots in private equity, is making its first push into digital assets as clearer regulations and institutional momentum pull traditional investors into the crypto space. Bloomberg reported Tuesday that the firm, which manages nearly $4b for some of the city’s wealthiest families, plans to allocate up…
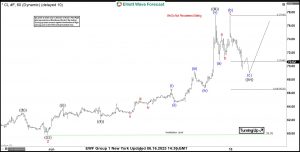
OIL (CL_F) Elliott Wave: Forecasting the Path
Hello fellow traders. In this technical article we’re going to take a quick look at the Elliott Wave charts of OIL , published in members area of the website. As our members are aware, OIL is now potentially forming irregular Flat pattern against the 55.25 low. Recently we saw a clear 3-wave pullback, followed by…
Anthony Pompliano Strikes $1B Merger to Launch Bitcoin-Native ProCap, Raises $750M to Go Public
American investor and entrepreneur Anthony Pompliano announced a $1 billion business merger to create a Bitcoin-native firm, ProCap Financial. The company has raised $750 million “from some of the leading institutional investors on Wall Street,” Pompliano posted on X. “The company will be a publicly traded entity on Nasdaq,” said Pompliano through a special purpose…
Israeli Man Accused of Spying for Iran in Exchange for Crypto — What’s Going On?
Israeli authorities have arrested a 27-year-old Tel Aviv resident on suspicion of spying for Iran in exchange for cryptocurrency, a case that deepens concerns about the use of digital payments in modern espionage. The man was taken into custody on Sunday by the Shin Bet security service and Tel Aviv police. According to investigators, he…
Fintech Firm Fiserv Taps PayPal and Circle to Power Its Stablecoin Initiative
Fiserv, one of the largest fintech firms in the US, announced plans Monday to launch its own US dollar-backed stablecoin, FIUSD. The company is teaming up with PayPal and Circle to expand digital asset services across its banking and payments network. It aims to roll out the token by the end of the year, tapping…
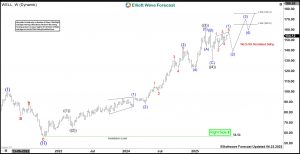
Welltower (WELL) Bullish Outlook: Targeting $176+ in 2025 Rally
Welltower Inc., (WELL) is the residential wellness & healthcare infrastructure company. It engages in the seniors housing operators, post-acute providers & health systems to fund the real estate infrastructure. They operating in the business include Senior Housing Operating, Triple-Net & Outpatient medical in United States, Canada & UK. It comes under “Real Estate” sector &…
Senator Adam Schiff Moves to Ban Presidents and Families From Profiting Off Crypto
Senator Adam Schiff (D-CA) introduced legislation on Monday that would bar the president, vice president, and their immediate family members from engaging in crypto-related business ventures while holding office. Key Takeaways: Senator Schiff’s COIN Act would bar the president and family members from issuing or endorsing crypto. The bill requires disclosure of any digital asset…


