

Hello fellow traders. In this technical article we’re going to take a look at the Elliott Wave charts charts of CADJPY Forex pair published in members area of the website. As our members know CADJPY is bullish against the 105.166 pivot and we prefer the long side. Recently the pair made a clear three-wave correction. The pull back completed as Elliott Wave Double Three pattern and made rally as expected. In this discussion, we’ll break down the Elliott Wave pattern and forecast. Elliott Wave Double Three Pattern Double three is the common pattern in the market , also known as 7 swing structure. It’s a reliable pattern which is giving us good trading entries with clearly defined invalidation levels. The picture below presents what Elliott Wave Double Three pattern looks like. It has (W),(X),(Y) labeling and 3,3,3 inner structure, which means all of these 3 legs are corrective sequences. Each (W) and (Y) are made of 3 swings , they’re having A,B,C structure in lower degree, or alternatively they can have W,X,Y labeling. 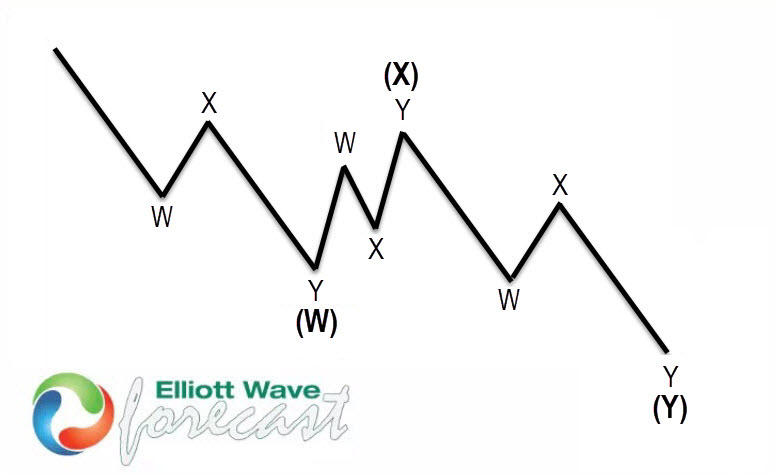
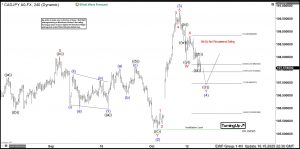
CADJPY Elliott Wave 4 Hour Chart 10.15.2025
CADJPY is forming a pullback against the 105.166 low. The correction remains incomplete at this time. The first leg shows a clear 3-wave structure ((w))–((x))–((y)) in black, followed by a 3-wave bounce in the red X leg. We expect to see another leg lower to complete the 3-wave pattern within the red Y leg as well. We advise against selling $CADJPY and instead favor the long side. Did you know ? 90% of traders fail because they don’t understand market patterns. Are you in the top 10%? Test yourself with this advanced Elliott Wave Test Official trading strategy on How to trade 3, 7, or 11 swing and equal leg is explained in details in Educational Video, available for members viewing inside the membership area. 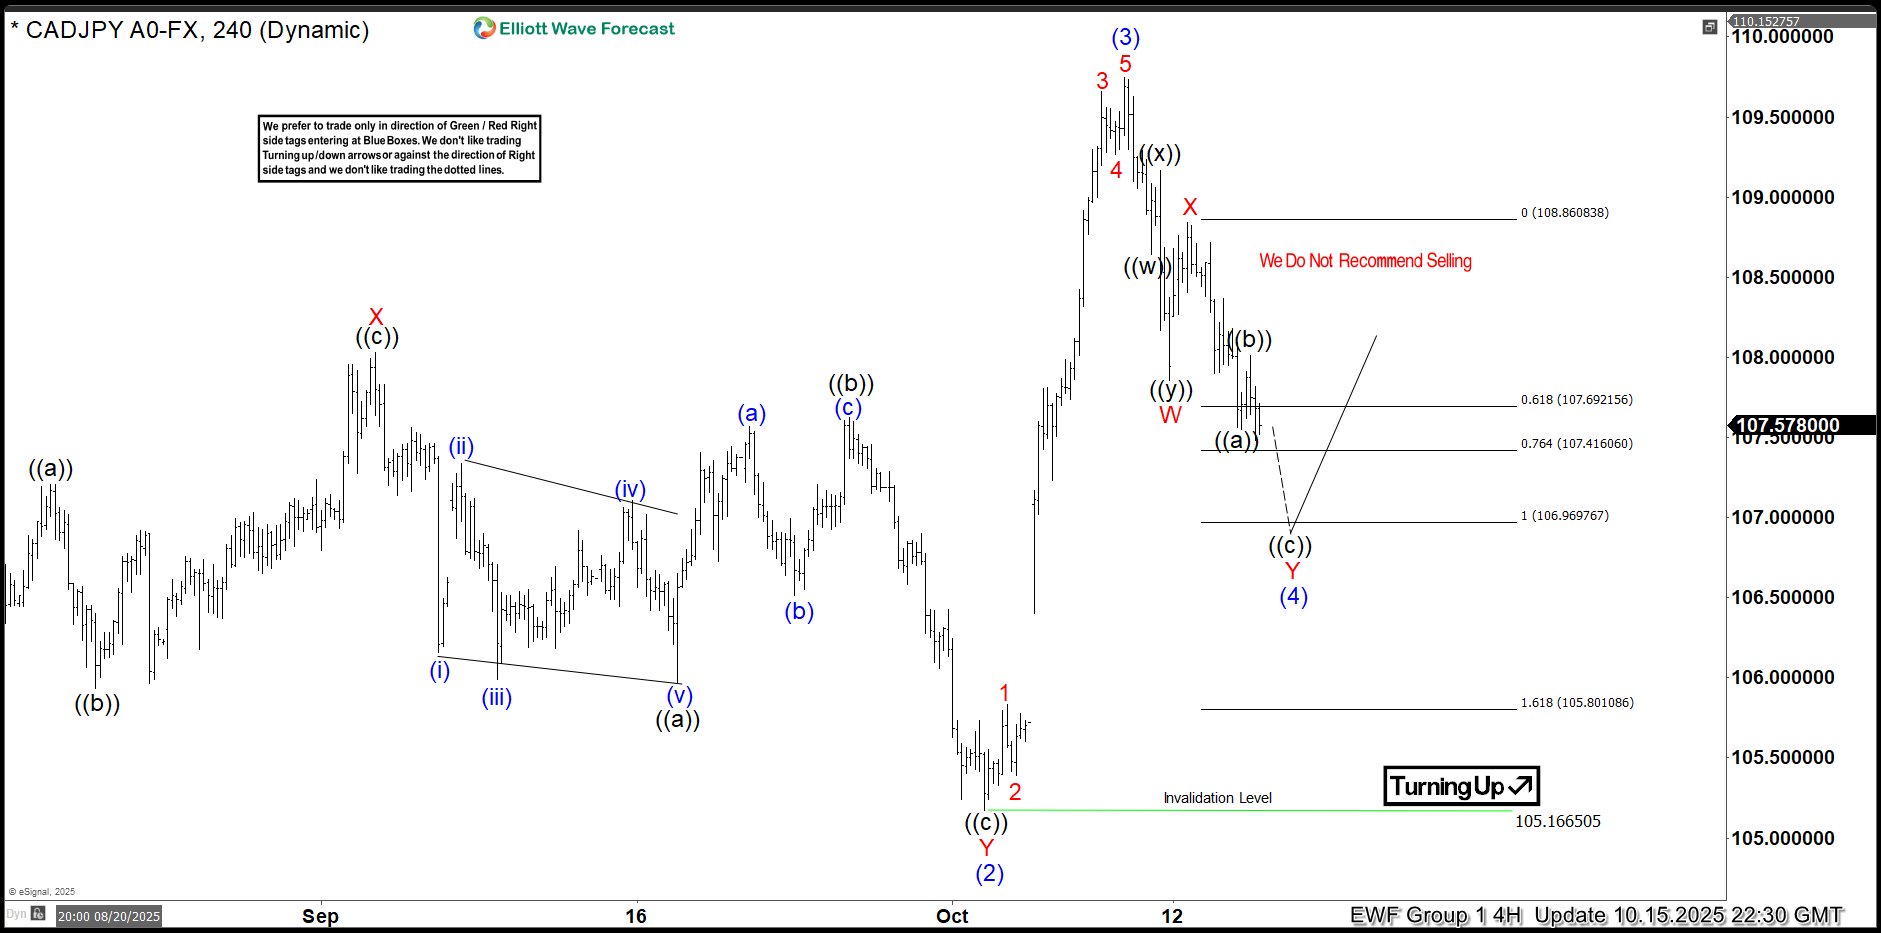
CADJPY Elliott Wave 4 Hour Chart 10.30.2025
CADJPY found buyers as expected. The forex pair has reacted strongly and eventually we got a break toward new highs. Now, intraday pull backs should ideally keep finding buyers as far as 106.195 pivot holds. Keep in mind that market is dynamic and presented view could have changed in the mean time. You can check most recent charts with target levels in the membership area of the site. Best instruments to trade are those having incomplete bullish or bearish swings sequences. We put them in Sequence Report and best among them are shown in the Live Trading Room New to Elliott Wave ? Check out our Free Elliott Wave Educational Web Page and download our Free Elliott Wave Book. 
Elliott Wave Forecast
At Elliott Wave Forecast, we track and analyze 78 instruments daily — but remember, not every chart is a direct trading signal.
For real-time, actionable trades, join our Live Trading Room, where we guide you through clear, professional setups every day.
🚀 Not a member yet? Now’s the perfect time, we have limited time Promo Offer :
Unlock full access with our 14-day Trial for just $0.99!
Here’s what you’ll get:
✅ Official Trading Signals — with clearly defined Entry, Stop Loss, and Take Profit levels based on our proven strategy.
✅ Live 24 Hour Chat Room Access — ask unlimited questions and get expert support during trading hours (Monday–Friday).
✅ Expert Analysis — real-time updates across Forex, Stocks, Indices, Commodities, Cryptos, and ETFs.
✅ Hands-on Learning — sharpen your trading skills with direct mentorship from seasoned market analysts.
Take the first step toward better, smarter trading 👉 Click here to start your Trial today!

The post CADJPY Elliott Wave : Calling the Rally From the Extreme Zone appeared first on Elliott Wave Forecast.