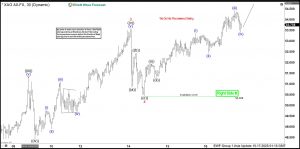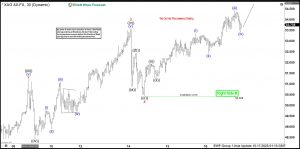
According to short-term Elliott Wave analysis, Silver (XAGUSD) has been in a strong impulsive rally since July 31. The metal initially surged to $38.73 in wave (1), pulled back to $36.94 ended wave (2), and then resumed its upward momentum in wave (3) higher. Whereas wave 1 of (3) ended at $39.06 high, wave 2 pullback ended at $38.06 low. Then a rally to $53.57 high ended wave 3. A subsequent corrective phase, wave 4, formed a zigzag pattern with a final low at $50.42, completing the wave 4. Silver then launched into wave 5, characterized by a five-wave internal structure. From the wave 4 low, the metal advanced in waves ((i)) to $51.93 and ((ii)) to $51.28 low, with minor sub-waves in waves (i) ended at $53.36 high and (ii) ended at $52.42 low. Up from there, wave (iii) ended at $54.42 high and wave (iv) at $53.40 low. Now as long as Silver stays above $50.40, dips are likely to attract buyers, potentially in a 3, 7, or 11-swing sequence, supporting further upside. This outlook suggests the bullish trend remains intact, with potential for additional gains as the impulsive structure unfolds.
Silver Latest 1-Hour Elliott Wave Chart From 10.17.2025
Silver Elliott Wave Video:
The post Bullish on Silver: Why Upside Potential Looks Promising appeared first on Elliott Wave Forecast.


