
Bitcoin predictions are divided right now. While some firmly believe that the world’s biggest cryptocurrency is still operating in four-year cycles of boom and bust, others argue that bull runs are getting longer — and a bear market remains some way off.
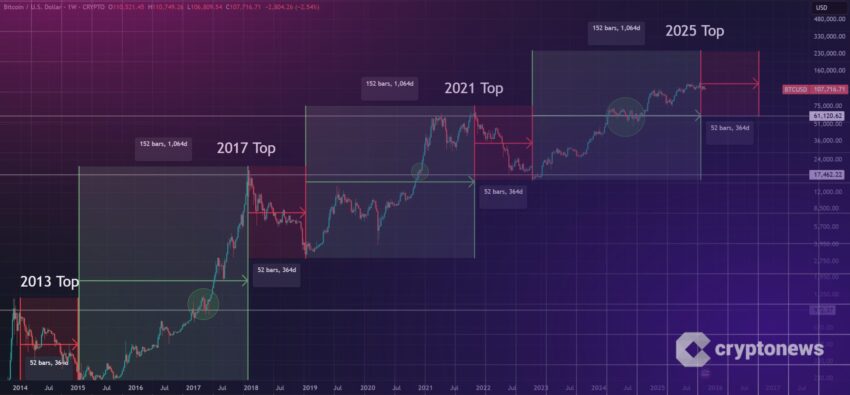
BTC’s behavior in past years has proven to be pretty consistent. During the past two cycles, it took about 1,000 days to move from the cycle’s lowest price to a fresh all-time high — of $19,834 in 2017, and about $69,000 in 2021.
After these milestones were reached, a brutal bear market lasting approximately one year followed, with Bitcoin then shedding about 80% of its value. From here, momentum then started to build again.
On Crypto Twitter, a screenshot of a forum post from December 2023 has been doing the rounds that took note of this pattern — and attempted to offer a Bitcoin prediction for the current cycle.
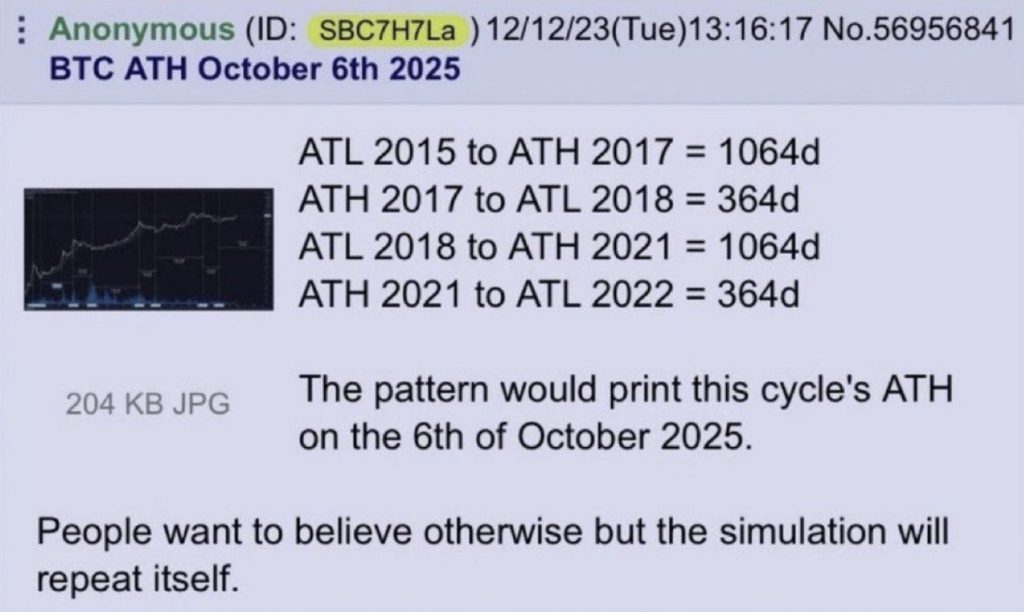
Here’s what’s especially spooky: Bitcoin’s latest all-time high (so far at least) was on October 6, 2025 — $126,198.07. So… are we about to see history repeat itself? Is 2026 going to end up becoming a bloodbath like 2018 and 2022 were?
At this point, I do want to add a word of caution. For one, there doesn’t seem to be an official source for that forum screenshot that’s gone viral online. Trust me, I’ve looked. Also, the figures in the post aren’t entirely accurate.
Let’s take the 2021/22 cycle as an example. The all-time high of $69,000 happened on November 10, 2021. The lowest daily close in the following bear market was on November 21, 2022 — 376 days later, not 364.
This then throws the rest of the sequence out of whack. Why? Because the period from this low point to October 6 of this year is 1,050 days — not 1,064.
You could argue that all of this amounts to splitting hairs. Whether the exact amount of days is correct or not, it still points to a compelling pattern. And that’s what makes this trading chart look so alarming.
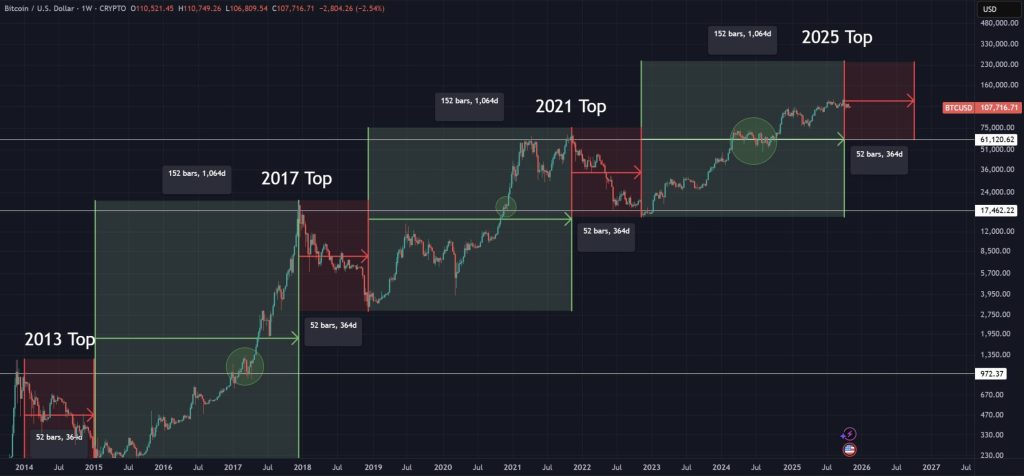
If Bitcoin replicates what’s happened in past cycles, a punishing drawdown is inevitable — and it could last until late 2026.
Between 2017 and 2018, Bitcoin contracted by 84% — bottoming out at $3,191.30. Then, in the aftermath of FTX crashing into bankruptcy, BTC crashed by 77%… dragging its price back down to $15,787.28.
An 80% drawdown from the most recent all-time high of $126,000 would see Bitcoin dwindle back to $25,000 — however, not everyone’s convinced that the next bear market will involve losses of this magnitude.
A key factor that makes this cycle different is the arrival of Bitcoin ETFs, which have led to billions of dollars in inflows from institutional investors. Market watchers argue that this has ultimately made BTC far less volatile than it was before. While we haven’t seen so-called “god candles” in the most recent bull market, it could mean the next inevitable bear market isn’t as bruising as those in the past.
However, new risks have also emerged. Treasury companies now own substantial amounts of Bitcoin — and have borrowed staggering amounts of money to acquire more. As interest rate payments loom for lenders, some may need to sell off parts of their BTC stash to stay afloat. The mere thought of Strategy offloading coins would be enough for some investors to panic.
One market strategist, Gareth Soloway, believes Bitcoin could slump to at least $75,000 a coin — “probably by early 2026.” However, he is bullish in the longer term, and believes this cryptocurrency will make a comeback further down the line.
BTC’s four-year cycles have become a necessary part of this cryptocurrency’s narrative — with each subsequent low after a bull market being higher than the last. Zooming out to a long-term chart, this creates the illusion of a staircase, where prices continue to appreciate over time.
Only time will tell whether the next crash is as severe as the 80% drawdowns of the past… and whether institutions will still have the same enthusiasm for BTC when the next bull market kicks off. Their inflows could prove crucial if this digital asset is to meet the $1 million price target set by the industry’s most vocal evangelists.
The post Bitcoin Predictions: Is The Bull Run Over? This Chart Says Yes appeared first on Cryptonews.