

Hello traders. In this technical article we’re going to look at the Elliott Wave charts of Bitcoin BTCUSD published in members area of the website. BTCUSD has recently given us a 3 waves recovery that found sellers as expected. In this discussion, we’ll break down the Elliott Wave forecast and present the target area.
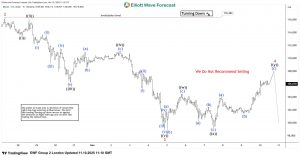
BTCUSD Elliott Wave 1 Hour Chart 11.10.2025
BTCUSD ended a 5-wave decline in the cycle from the 116.323 peak. Currently, the crypto is showing a recovery against that peak — wave 4 red. As our members know, we determine the potential ending point of a correction by measuring the equal legs area. In this case, we measure the 1.00–1.618 Fibonacci extension of waves ((w))–((x)). The reversal area (sellers’ zone) comes at 104.942–108.471. The price is already within the sellers’ zone, and we anticipate another leg down from this area or at least a 3-wave pullback.
You can learn more about Elliott Wave Patterns at our Free Elliott Wave Educational Web Page
90% of traders fail because they don’t understand market patterns. Are you in the top 10%? Test yourself with this advanced Elliott Wave Test 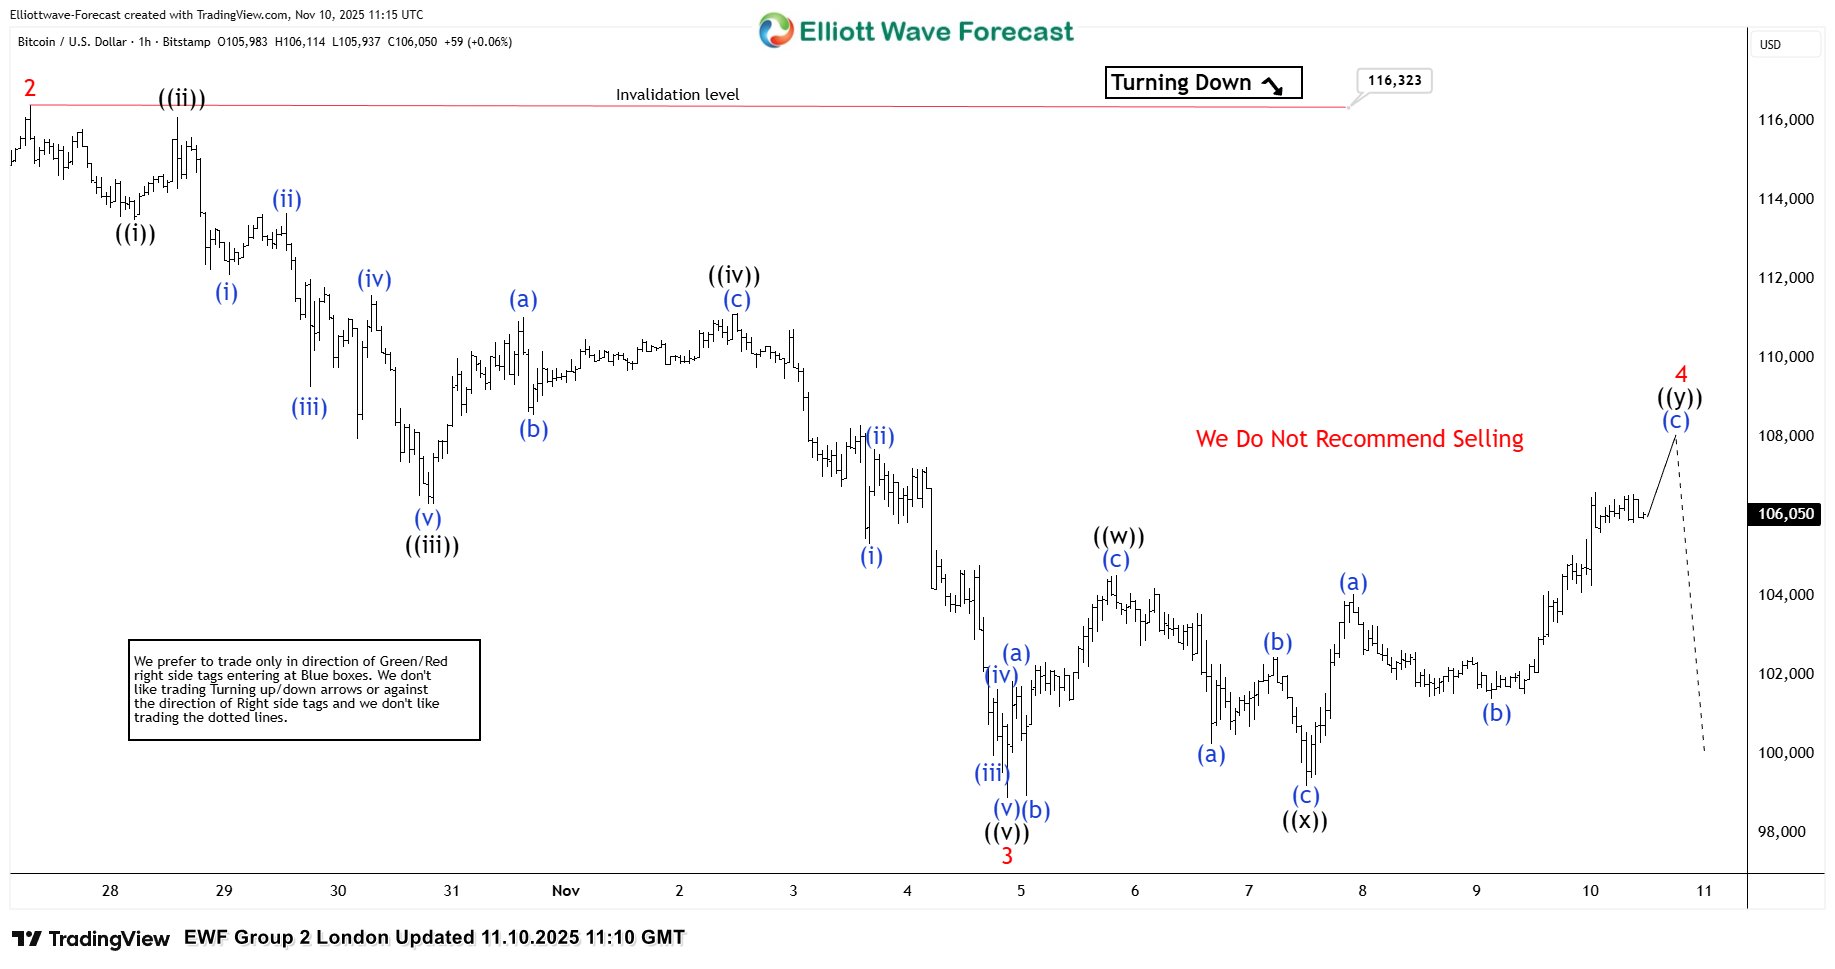
BTCUSD Elliott Wave 1 Hour Chart 11.12.2025
The crypto ended wave 4 within the mentioned area, and we got a decent decline as expected. Ideally, the price should break below the previous low – wave 3 red – to confirm that wave 5 is in progress toward the 96,962–93,704 area. Keep in mind, we don’t recommend selling Bitcoin. The overall trend remains bullish according to higher time frames, and we will treat any pullback as a potential buying opportunity. For trading setups, please follow our Live Trading Room Reminder for members: Our chat rooms in the membership area are available 24 hours a day, providing expert insights on market trends and Elliott Wave analysis. Don’t hesitate to reach out with any questions about the market, Elliott Wave patterns, or technical analysis. We’re here to help. 

Elliott Wave Forecast
At Elliott Wave Forecast, we track and analyze 78 instruments daily — but remember, not every chart is a direct trading signal.
For real-time, actionable trades, join our Live Trading Room, where we guide you through clear, professional setups every day.
🚀 Not a member yet? Now’s the perfect time, we have limited time Promo Offer :
Unlock full access with our 14-day Trial for just $0.99!
Here’s what you’ll get:
✅ Official Trading Signals — with clearly defined Entry, Stop Loss, and Take Profit levels based on our proven strategy.
✅ Live 24 Hour Chat Room Access — ask unlimited questions and get expert support during trading hours (Monday–Friday).
✅ Expert Analysis — real-time updates across Forex, Stocks, Indices, Commodities, Cryptos, and ETFs.
✅ Hands-on Learning — sharpen your trading skills with direct mentorship from seasoned market analysts.
Offer Expires Soon!
Get full access to real-time Signals, Live Sessions, 24 Hour Chat Room Support and Expert Analysis — all for only $0.99 during your 14-day trial.
⏳ This limited-time price will expire soon — don’t miss out!
The post Bitcoin BTCUSD Elliott Wave Analysis : Forecasting the Decline After 3-Wave Recovery appeared first on Elliott Wave Forecast.