
The SPDR S&P Biotech ETF (XBI) draws investors who seek high-risk, high-reward exposure to the biotech sector. In late 2025, investor sentiment remains cautiously optimistic. This reflects both strong opportunities and ongoing uncertainty. Analysts set a 12-month price target near $141.31. That suggests a 48% upside from current levels around $95. Technical indicators support this outlook. Twelve out of seventeen signal “Buy,” and none recommend “Sell.” Still, some analysts urge caution. XBI depends on clinical trials and faces unpredictable earnings. Its volatility requires careful planning and strong risk tolerance. Financial growth prospects for XBI look promising. Macroeconomic trends and biotech advances shape its performance. The industry expects gains from rising healthcare spending and aging populations. Breakthroughs in personalized medicine also support long-term growth. Investors remain hopeful about gene editing, immunotherapy, and rare disease treatments. However, they must manage risks from regulation and market swings. XBI offers strong growth potential but demands patience and a strategic mindset.
Elliott Wave Structure: XBI Weekly Chart April 05th 2025
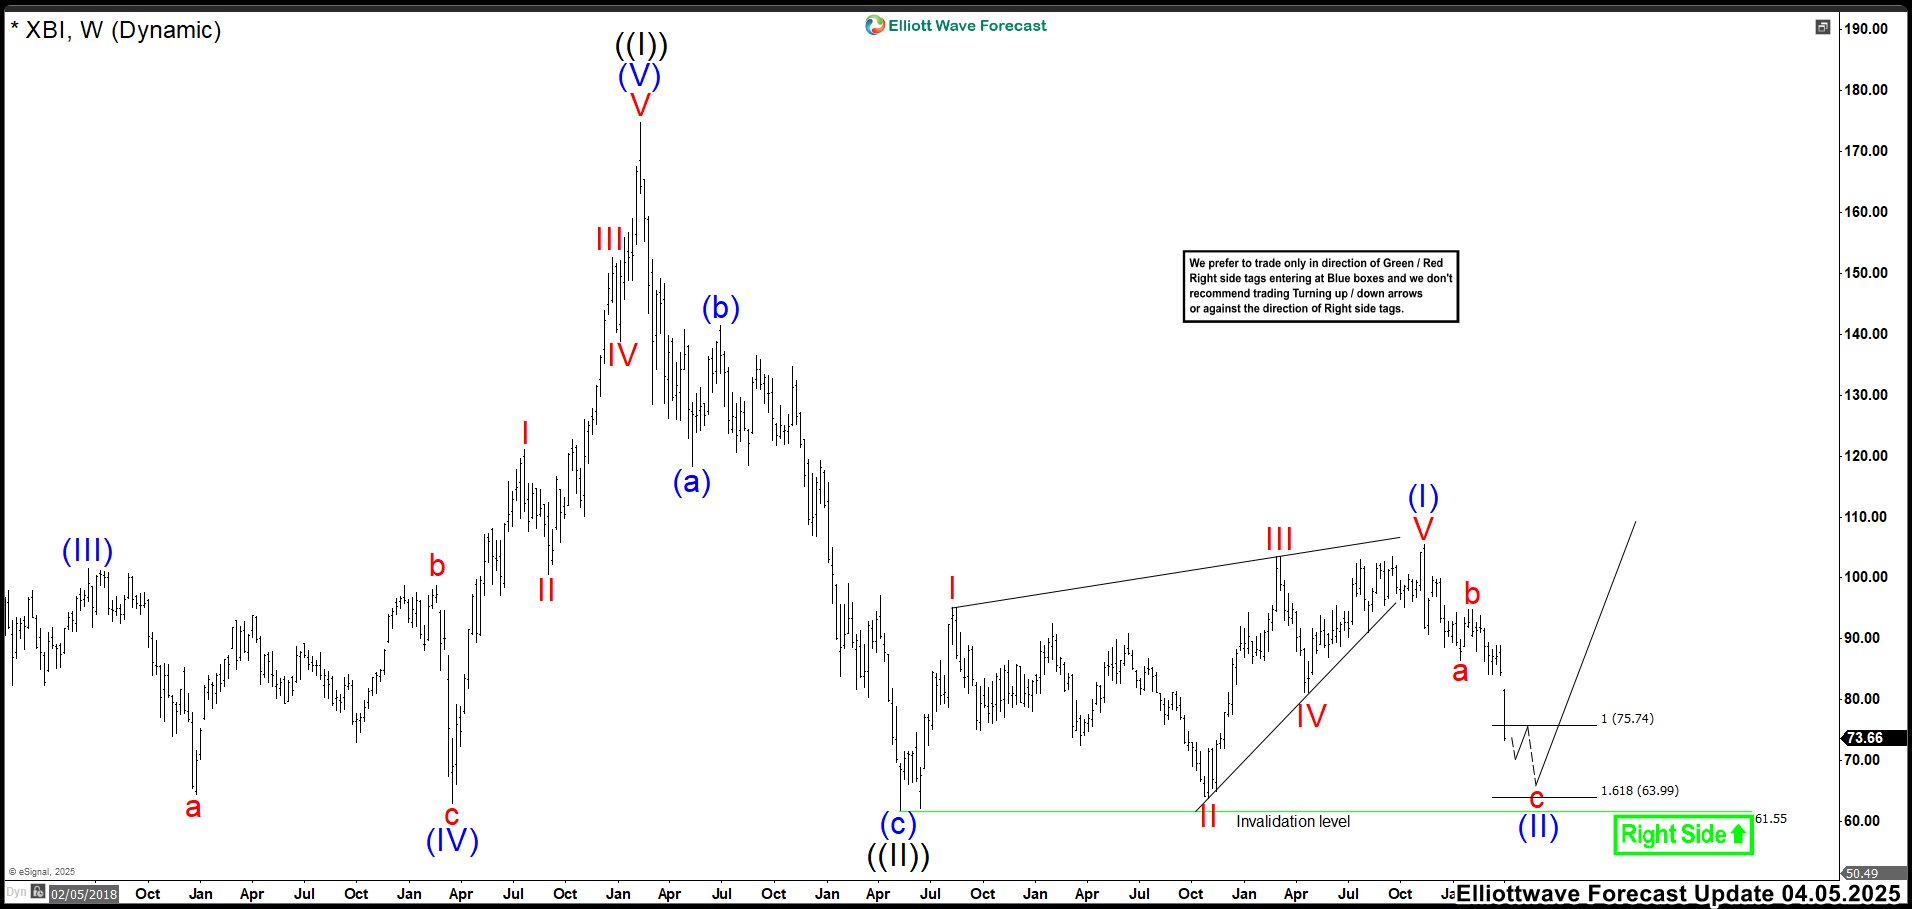 Months ago, we anticipated a correction in XBI. The market followed our forecast and confirmed both the expected decline and the reaction higher. Wave “a” formed a leading diagonal, ending at 86.40. Then, wave “b” peaked at 88.98, completing the corrective setup. Wave “c” of (II) triggered a strong decline into the 75.74–63.99 extreme zone for wave (II). We expected a response higher from this area to resume the rally. The Biotechnology sector reached this zone, validating our Elliott Wave analysis. Additionally, we noted that a break below 61.78 would open the path toward the 41.33–36.09 region. If you’re eager to dive deeper into Elliott Wave Theory and learn how its principles apply to market forecasting, you might find these resources helpful: and .
Elliott Wave Structure: XBI Weekly Chart September 09th 2025
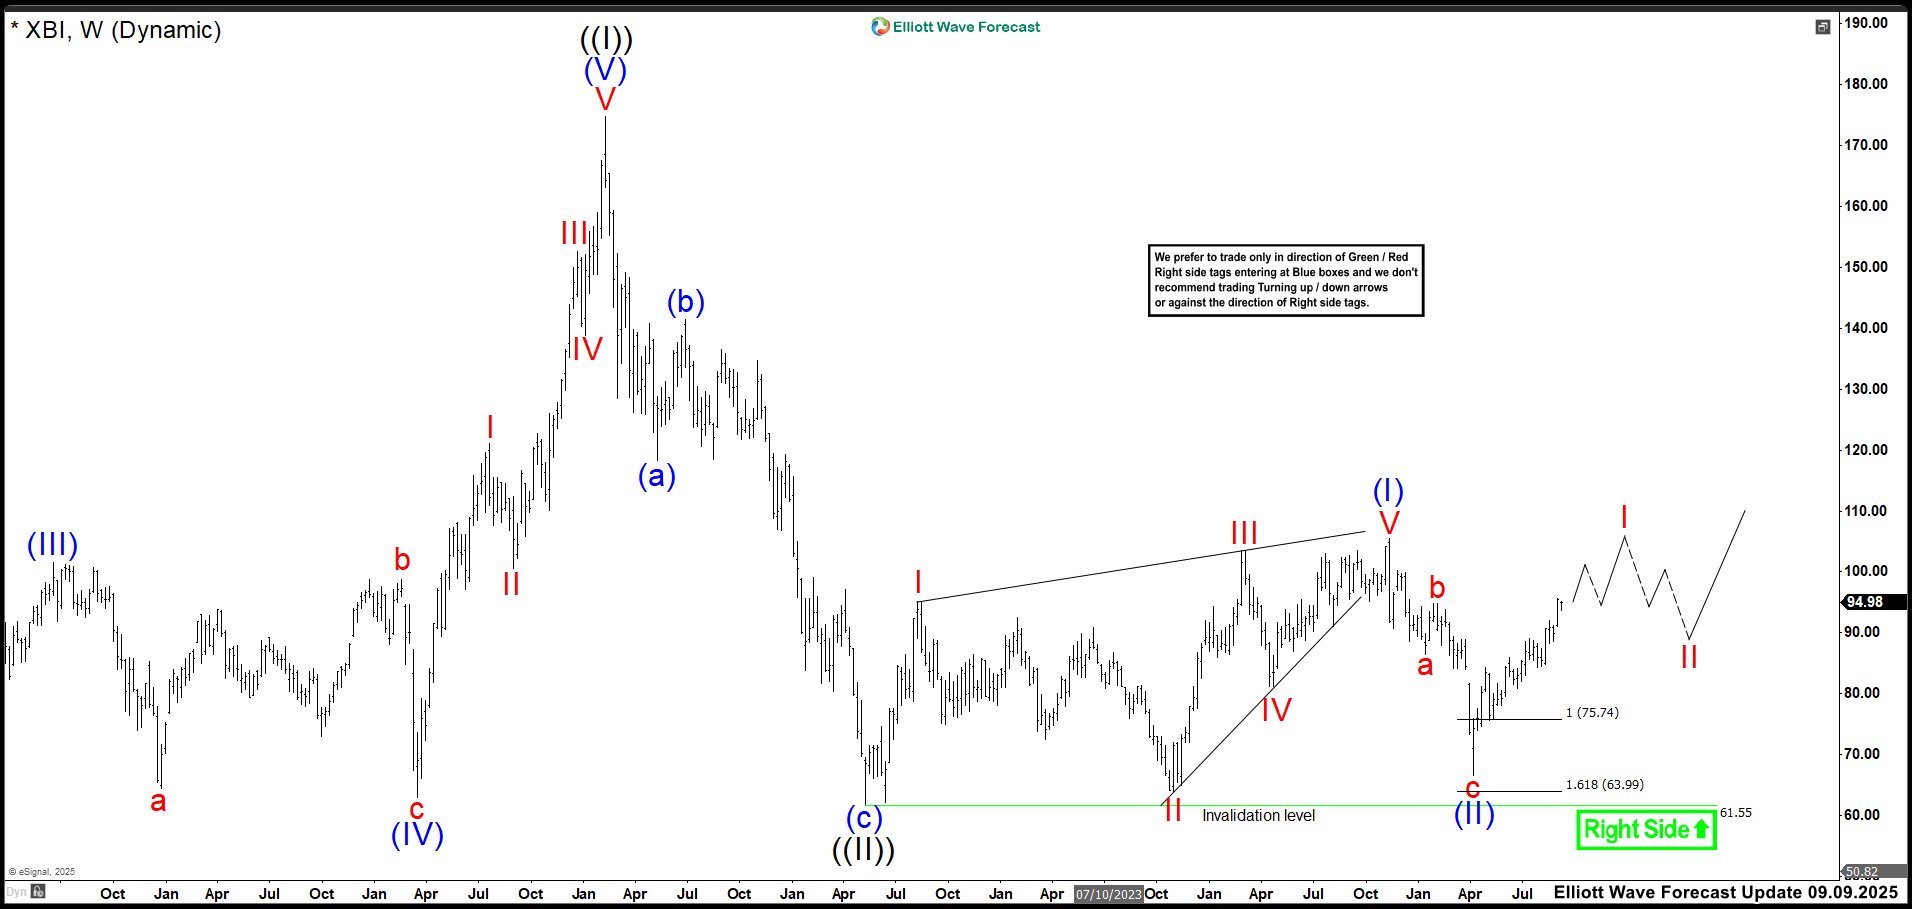 In this latest update, we observe that wave (II) ended at the low of 66.66, right within the expected zone. The price then moved higher, aligning with our forecast. Currently, XBI trades at 94.98, delivering an impressive return of approximately 30%. We believe the price should continue rising to complete the impulsive structure as wave I. The final target for wave I remains uncertain, but we rely on the fractal structure to guide us. This helps us anticipate when a correction may begin, whether it unfolds in 3, 7, or even 11 swings, as part of wave II. Transform Your Trading with Elliott Wave Forecast! Ready to take control of your trading journey? At Elliott Wave Forecast, we provide the tools you need to stay ahead in the market: ✅ Blue Boxes: Stay ahead in the market with fresh 1-hour charts updated four times daily, daily 4-hour charts on 78 instruments, and precise Blue Box zones that highlight high-probability trade setups based on sequences and cycles. ✅ Live Sessions: Join our daily live discussions and stay on the right side of the market. ✅ Real-Time Guidance: Get your questions answered in our interactive chat room with expert moderators. 🔥 Special Offer: Start your journey with a 14-day trial for only $9.99. Gain access to exclusive forecasts and Blue Box trade setups. No risks, cancel anytime by reaching out to us at support@elliottwave-forecast.com. 💡 Don’t wait! Elevate your trading game now. Trial us at: 🌐
The post Biotech Surge: XBI Ends Correction and Rallies as Expected appeared first on Elliott Wave Forecast.