

Hello fellow traders. In this technical article, we are going to present Elliott Wave trading setup of Bank of America (BAC) . The stock completed its corrective decline precisely at the Equal Legs area, also known as the Blue Box. In the following sections, we’ll break down the Elliott Wave structure in detail and explain the setup and present the target levels.
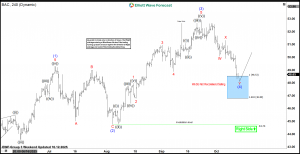
BAC Elliott Wave 4 Hour Chart 10.12.2025
The current analysis suggests that BAC stock is forming a wave (4) pull back, which is unfolding as an Elliott Wave Double Three pattern . Blue Box comes at 48.53-46.8. That is our buying zone. We recommend members avoid selling BAC stock, as the main trend remains bullish. We anticipate at least a 3-wave bounce from this Blue Box area. Once the price touches the 50% fib level against the X red connector, we’ll make positions risk-free, set the stop-loss at breakeven, and book partial profits. Stop Loss is placed a few points below 1.618 fib extension : 46.8
90% of traders fail because they don’t understand market patterns. Are you in the top 10%? Test yourself with this advanced Elliott Wave Test Official trading strategy on How to trade 3, 7, or 11 swing and equal leg is explained in details in Educational Video, available for members viewing inside the membership area. Quick reminder on how to trade our charts : Red bearish stamp+ blue box = Selling Setup Green bullish stamp+ blue box = Buying Setup Charts with Black stamps are not tradable. 🚫 
BAC Elliott Wave 4 Hour Chart 10.12.2025
The stock found buyers into the Blue Box area, just as expected. The stock made a decent reaction higher from our buying zone. As a result all long positions are risk free + partial profits have been taken. As long as price holds pivot at the 48.32 low , further upside remains likely, targeting 53.95-55.69 area next.
Reminder for members: Our chat rooms in the membership area are available 24 hours a day, providing expert insights on market trends and Elliott Wave analysis. Don’t hesitate to reach out with any questions about the market, Elliott Wave patterns, or technical analysis. We’re here to help 
Elliott Wave Forecast
At Elliott Wave Forecast, we track and analyze 78 instruments daily — but remember, not every chart is a direct trading signal.
For real-time, actionable trades, join our Live Trading Room, where we guide you through clear, professional setups every day.
🚀 Not a member yet? Unlock full access with our 14-day Trial for just $9.99!
Here’s what you’ll get:
✅ Official Trading Signals — with clearly defined Entry, Stop Loss, and Take Profit levels based on our proven strategy.
✅ Live 24 Hour Chat Room Access — ask unlimited questions and get expert support during trading hours (Monday–Friday).
✅ Expert Analysis — real-time updates across Forex, Stocks, Indices, Commodities, Cryptos, and ETFs.
✅ Hands-on Learning — sharpen your trading skills with direct mentorship from seasoned market analysts.
💬 Whether you’re an experienced trader or just getting started, Elliott Wave Forecast provides the tools, strategies, and support you need to trade with confidence.
Interested in joining us? 👉 View pricing and plans.
14 Days Trial 👉 Click here to start your Trial today!
The post Bank of America (BAC) Rallies Strongly from the Buying Zone appeared first on Elliott Wave Forecast.