

American Express (AXP) delivered strong Q4 results, boosting investor confidence heading into the next quarter. Card member spending surged, net interest income rose 12%, and fee growth accelerated. As a result, management expects revenue to grow 8–10% in Q1 2026. Moreover, they increased the quarterly dividend by 17%, signaling optimism and financial strength. These moves reflect a strategic focus on technology, customer engagement, and international expansion. Therefore, it is expected to continue momentum, especially among millennial and Gen Z users. Analysts remain cautiously optimistic about AXP’s near-term outlook. Out of 26 experts, 16 recommend holding, while 8 suggest buying the stock. The average price target stands at $319.95, slightly below the current price, indicating limited upside. However, some bullish forecasts reach as high as $394, showing confidence in long-term growth. In addition, effective risk management and rising net income support stability. Consequently, AXP appears well-positioned to balance growth and shareholder value in the coming months.
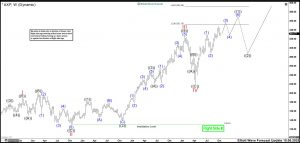
Elliott Wave Outlook: AXP Weekly Chart January 03rd
 AXP extended its rally in January 2025, reaching the upper range of 264.28–277.31 and surpassing market expectations. Wave ((5)) of III gained strength, pushing momentum higher. We projected the cycle to peak near 320.00 before a wave IV pullback began. If you’re eager to dive deeper into Elliott Wave Theory and learn how its principles apply to market forecasting, you might find these resources helpful: and .
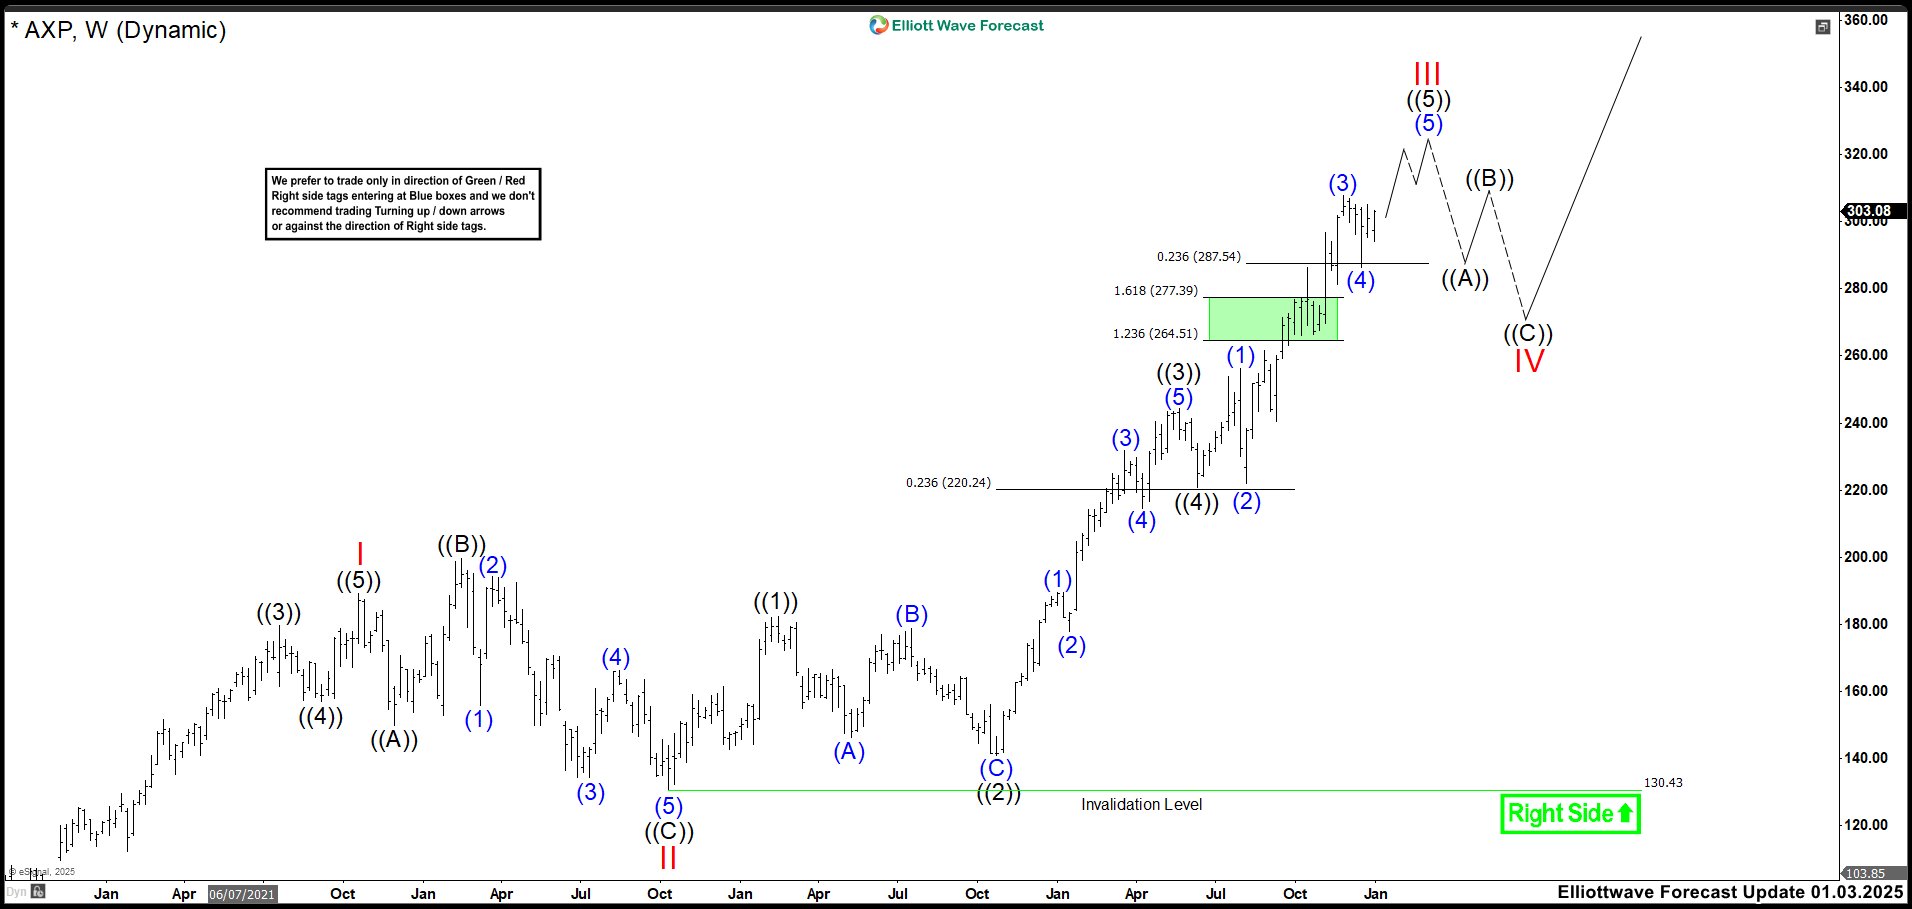
Elliott Wave Outlook: AXP Weekly Chart April 05th
 AXP reached a high of 326.27, completing wave ((5)) of III before sharply reversing lower. Sellers broke support near 290, triggering wave IV. This pullback formed a zigzag correction, revisiting the previous wave ((4)) zone and bottoming at 220.43. The structure confirmed a temporary shift in momentum, but bullish sentiment remained intact. Wave ((1)) unfolded with strong upward pressure that appeared likely to continue. AXP could rally toward new highs, targeting the 351.70–392.36 zone. Investors should watch for confirmation signals.
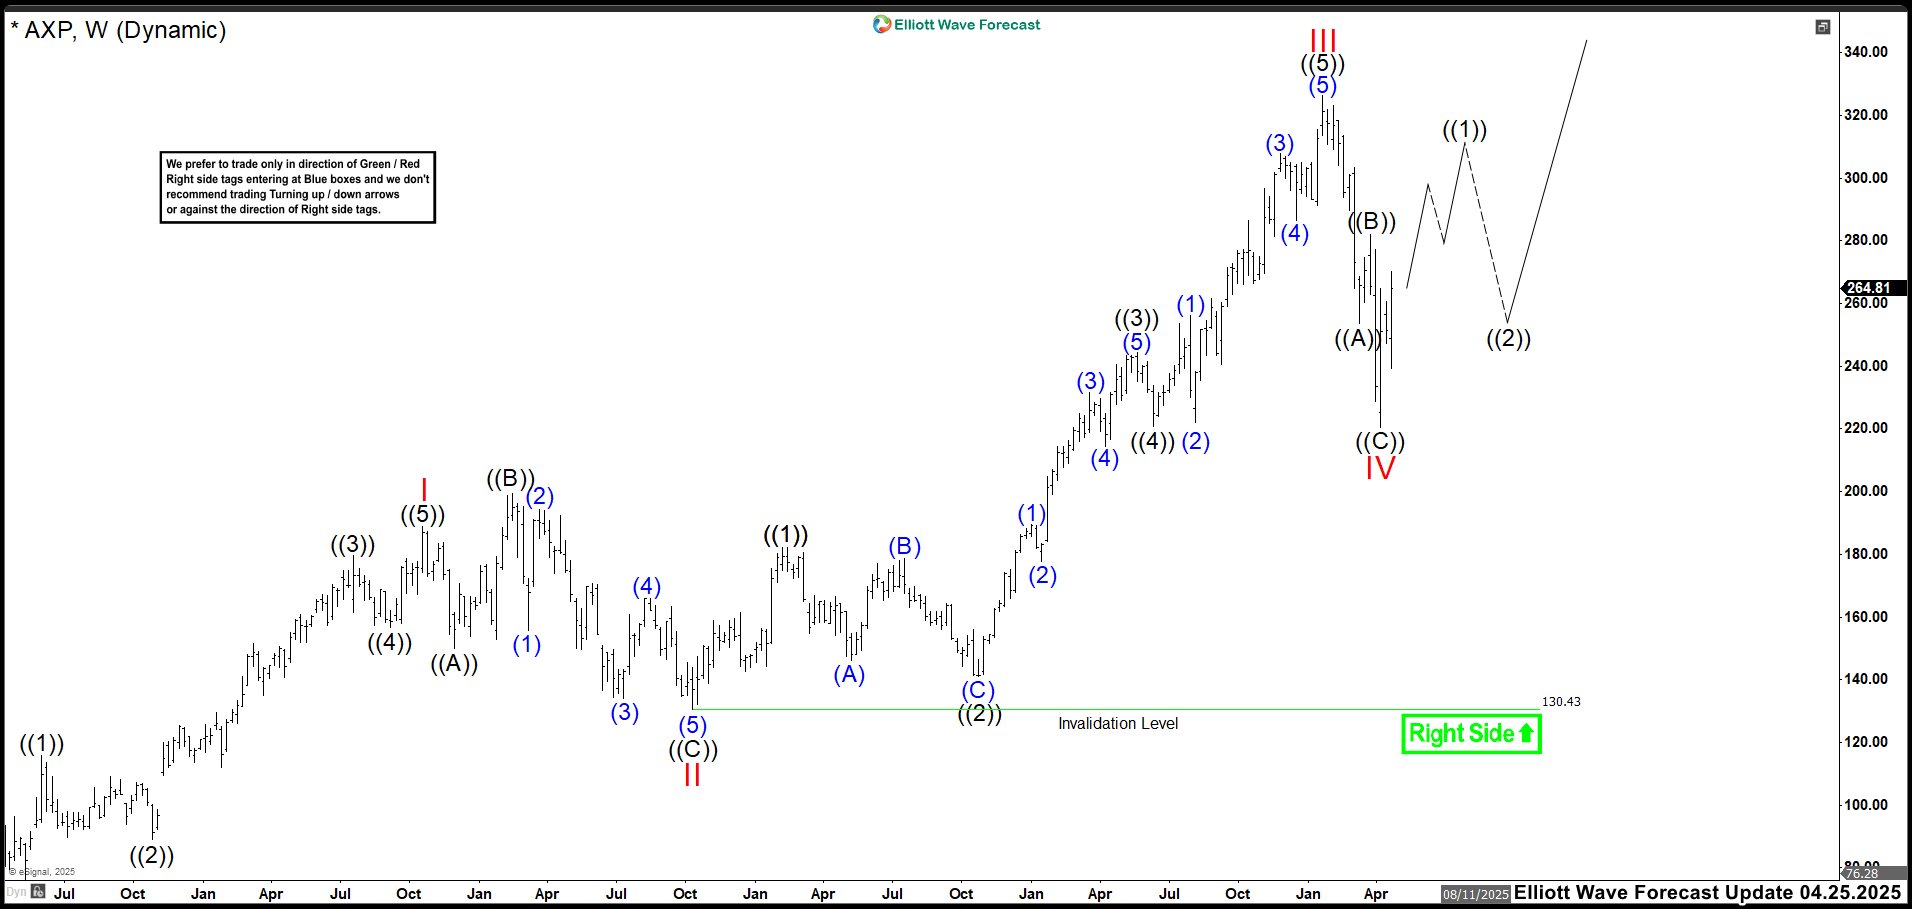
Elliott Wave Outlook: AXP Weekly Chart October 06th
 AXP continued rising after completing wave IV and broke above the wave III high. This confirms wave IV likely ended. Now, the market appears to be unfolding wave ((1)) of V, showing bullish momentum. We expect an impulsive structure to complete the cycle soon. If the move is impulsive, the chart should reflect a clear five-wave pattern. However, if it’s a leading diagonal, wave (3) may have ended, and wave (4) could be underway. Either way, we anticipate more upside toward the 351.70–392.36 zone. The key now is identifying the Elliott structure that offers the best exit before correction begins.
Transform Your Trading with Elliott Wave Forecast!
Ready to take control of your trading journey? At Elliott Wave Forecast, we provide the tools you need to stay ahead in the market: ✅ Blue Boxes: Stay ahead in the market with fresh 1-hour charts updated four times daily, daily 4-hour charts on 78 instruments, and precise Blue Box zones that highlight high-probability trade setups based on sequences and cycles. ✅ Live Sessions: Join our daily live discussions and stay on the right side of the market. ✅ Real-Time Guidance: Get your questions answered in our interactive chat room with expert moderators. 🔥 Special Offer: Start your journey with a 14-day trial for only $0.99. Gain access to exclusive forecasts and Blue Box trade setups. No risks, cancel anytime by reaching out to us at support@elliottwave-forecast.com. 💡 Don’t wait and get a DISCOUNT for any plan! Click in the next link, go to Home Chat and ask for a flat discount code saying that you saw this in Luis’ Blog: 🌐
The post AXP Approaches Exhaustion Zone: Is a Correction Looming? appeared first on Elliott Wave Forecast.