

7 Swing WXY correction
 Elliott Wave Structure Favors More Downside.")
$AMD Daily Elliott Wave Chart 3.02.2025:
 In the Daily Wave count from March 02, 2025, we see that $AMD completed a 5-wave impulsive cycle beginning on October 13, 2022, and ending on March 08, 2024, at the blue (I). As expected, this initial wave prompted a pullback. We anticipated this pullback to unfold in 7 swings, likely finding buyers in the equal legs area between $101.11 and $80.69. This setup aligns with a typical Elliott Wave correction pattern (WXY), where the market pauses briefly before resuming the main trend.
$AMD Daily Elliott Wave Chart 3.23.2025:
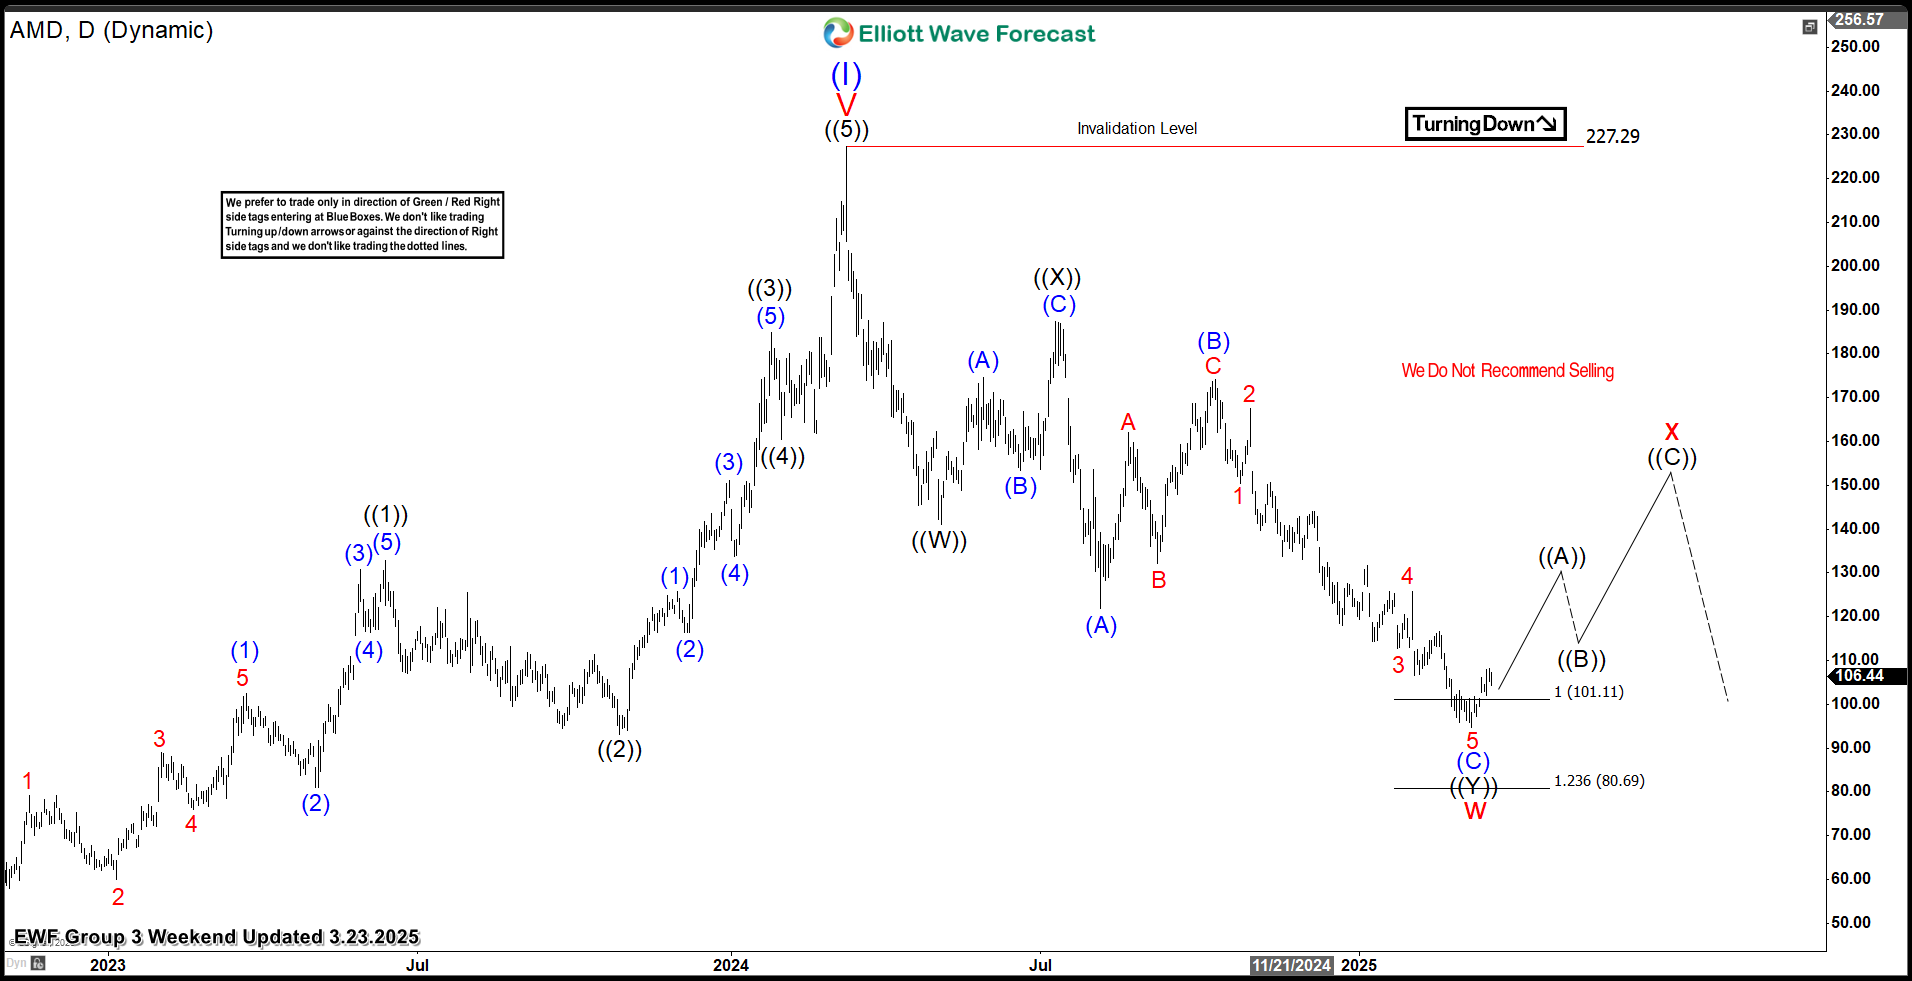 The most recent update, from March 23, 2025, shows that $AMD reacted as predicted. After the decline from the recent peak, the stock found support in the equal legs area, leading to a renewed rally. As a result, traders could adjust to go risk-free once we reach $141 which is the 50% retracement from the wave ((X)) connector.
What’s Next for $AMD?
With the current rally, $AMD appears well-supported. Based on the Elliott Wave structure, we expect the stock to continue its upward trajectory, targeting the $141 – $152 range before another potential pullback. Therefore, it is essential to keep monitoring this zone as we approach it.
Conclusion
Elliott Wave Forecast
The post Advanced Micro Devices Inc. $AMD Offers A Buying Opportunity and Can Reach $141 appeared first on Elliott wave Forecast.