

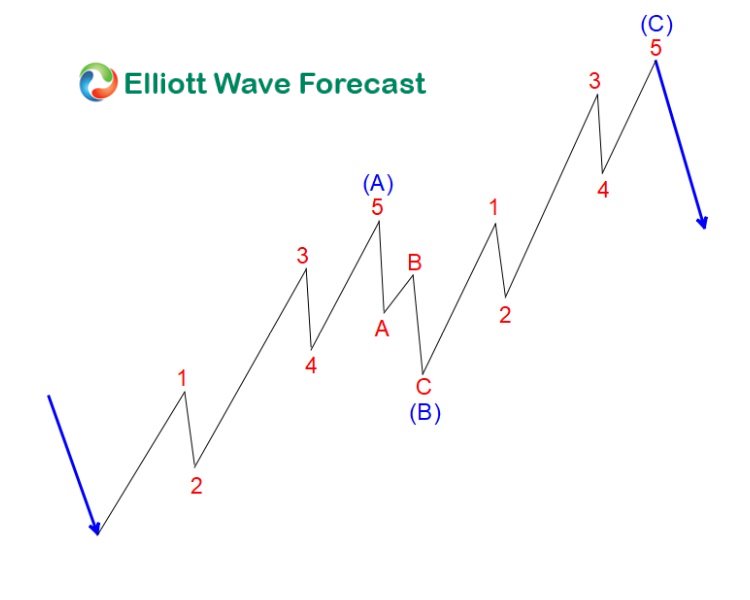
Zig-Zag ABC correction
$AMD 1H Elliott Wave Chart 12.23.2024:
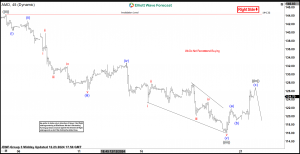
 In the 1-hour Elliott Wave count from December 23, 2024, we see that $AMD completed a 5-wave impulsive cycle beginning on December 05, 2024, and ending on December 20, 2024, at the black ((iii)). As expected, this initial wave prompted a bounce. We anticipated this bounce to find sellers after unfolding in 3 swings. This setup aligns with a typical Elliott Wave correction pattern (ABC), where the market pauses briefly before resuming the main trend.
$AMD 1H Elliott Wave Chart 12.30.2024:
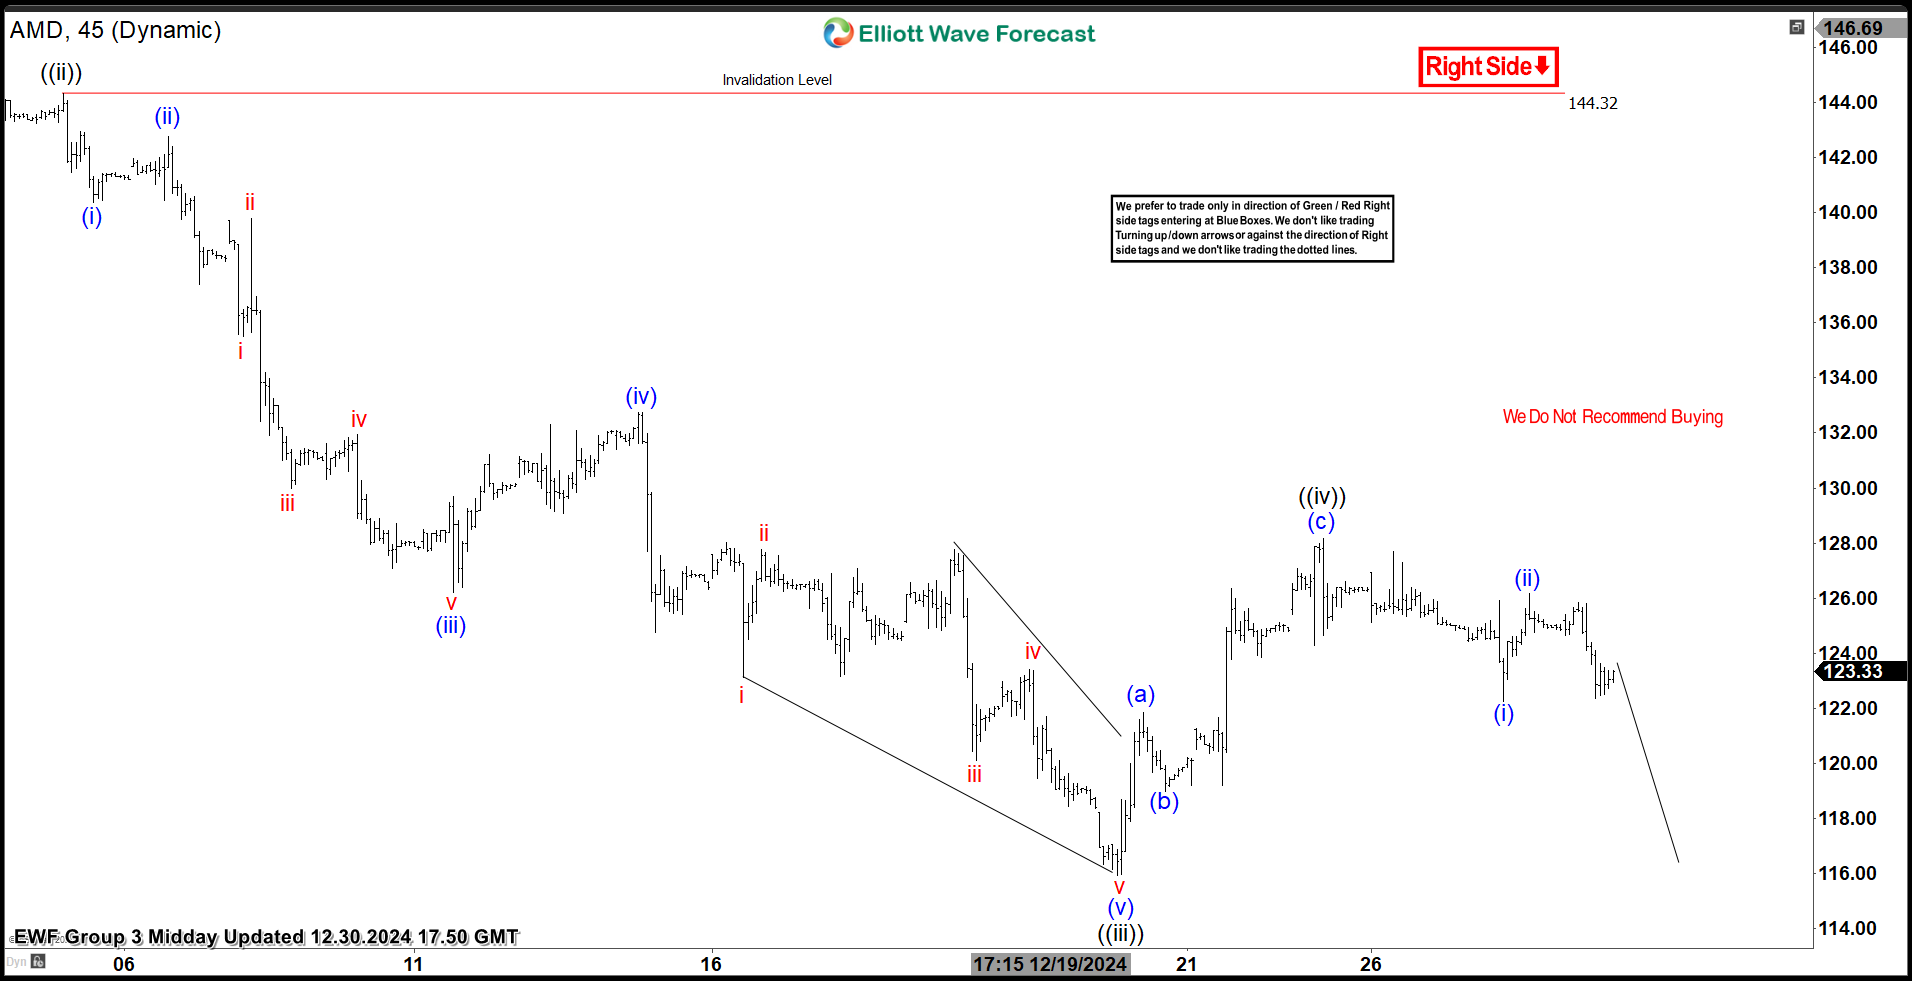 The most recent update, from December 30, 2024, shows that $AMD reacted as predicted. After the bounce from the recent low, the stock found sellers after 3 swings up, leading to a decline.
What’s Next for $AMD?
With the current decline, $AMD sellers are in control. Based on the Elliott Wave structure, we expect the stock to continue its downward trajectory, targeting the $113 – $108 range before another potential bounce. Therefore, it is essential to keep monitoring this zone as we approach it.
Conclusion
The post Advanced Micro Devices $AMD, Inc. Bearish Sequence Calls for More Downside appeared first on Elliott wave Forecast.