
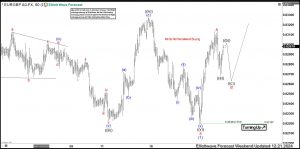

EURGBP has been one of the most fascinating currency pairs in the forex market for years. After a minor bounce in July, the pair broke lower again and is now approaching the March 2022 lows. Consequently, we expect the downside to continue for several weeks toward our projected targets. So, when and where should traders look for opportunities? Between July 2015 and March 2020, the pair completed a 5-wave bullish cycle. According to Elliott Wave Theory, a 3-wave correction typically follows a 5-wave trend. This is precisely what unfolded. Since March 2020, the pair has experienced multiple sell-offs to correct the nearly 5-year trend. We identified this corrective phase as a double zigzag structure, a 7-swing pattern. The first leg (wave W) ended in March 2022 but remains incomplete. Wave X, acting as the connector, followed and ended in September 2022. Since then, we have been counting wave Y, which began in September 2022.
EURGBP Daily Chart – 12.21.2024 Weekend Update
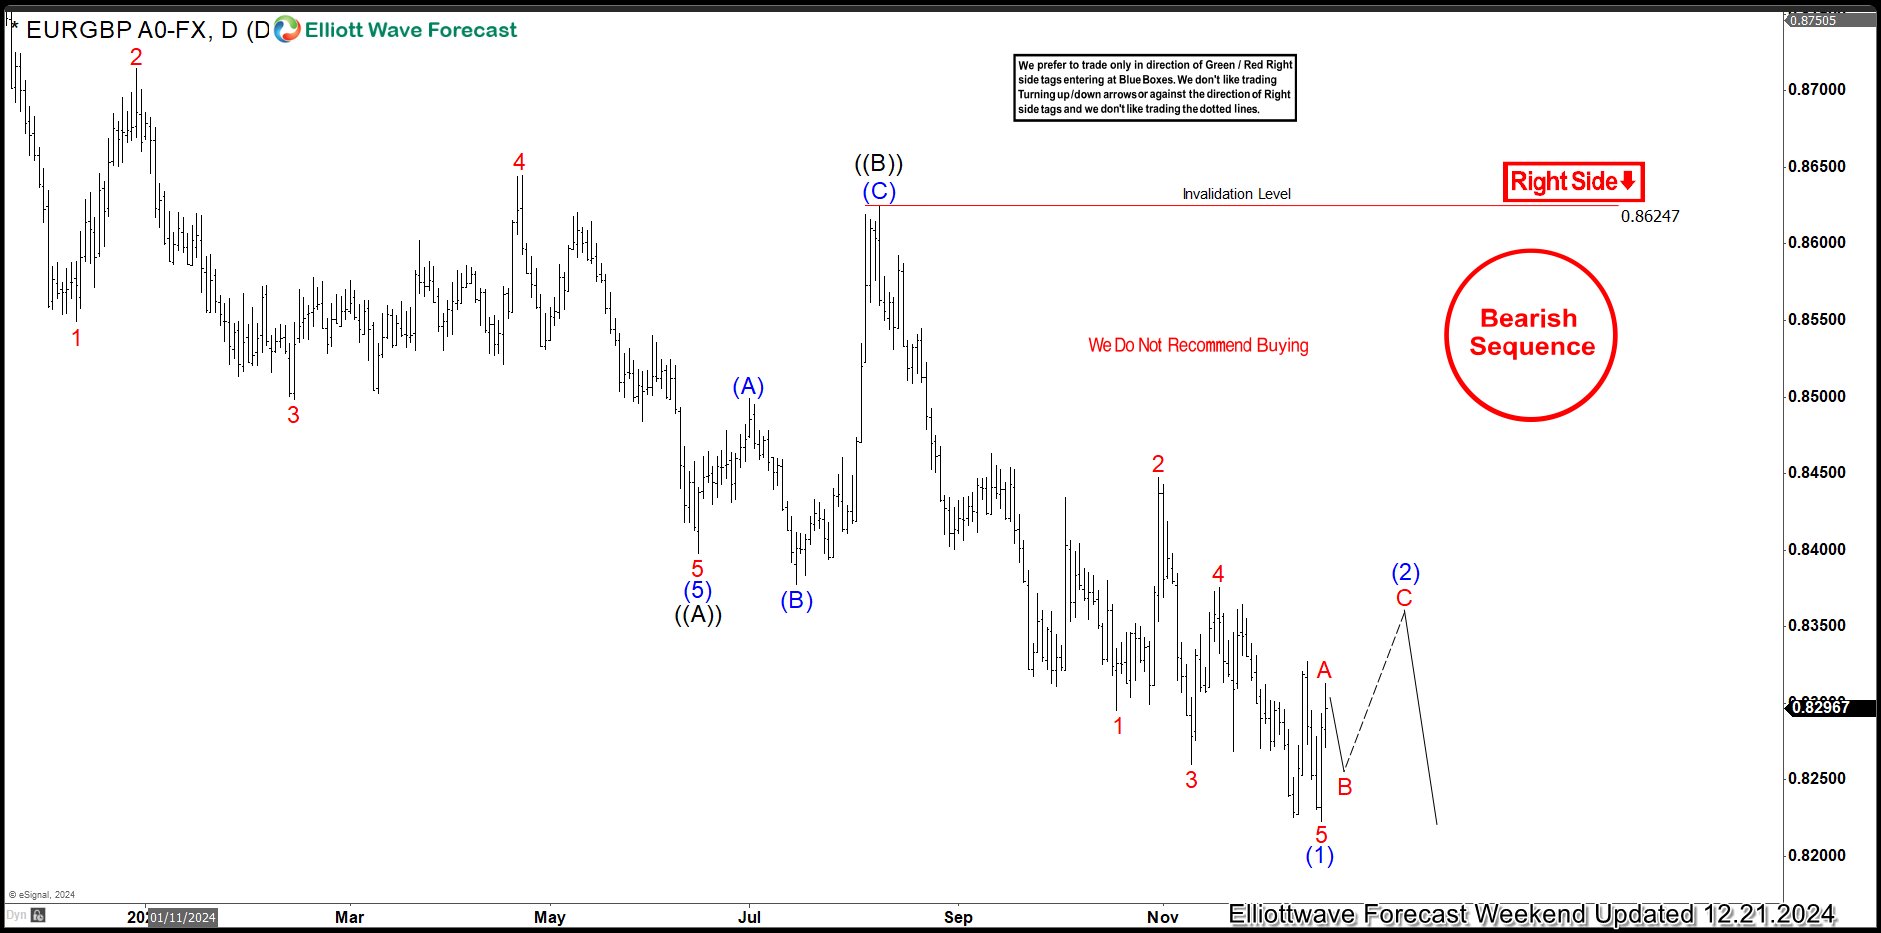
EURGBP H1 Chart – 12.21.2024 Weekend Update
About Elliott Wave Forecast
At www.elliottwave-forecast.com, we update one-hour charts four times daily and four-hour charts once daily for all 78 instruments. We also conduct daily live sessions to guide clients on the right side of the market. Additionally, we have a chat room where moderators answer market-related questions. Experience our service with a 14-day trial for only $0.99. Cancel anytime by contacting us at support@elliottwave-forecast.com.
The post EURGBP Elliott Wave Analysis – where can sellers enter again? appeared first on Elliott wave Forecast.