

$XME Daily Elliott Wave Chart 4.06.2025:
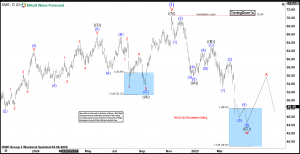
 In the Daily Elliott Wave count from April 06, 2025, we see that $XME completed a 5-wave impulsive cycle at blue ((I)). As expected, this initial wave prompted a pullback. We anticipated this pullback to unfold in 3 swings first, likely finding buyers in the equal legs area between $48.07 and $38.93. This setup aligns with a typical Elliott Wave correction pattern (ABC), in which the market pauses briefly before resuming its primary trend.
$XME Daily Elliott Wave Chart 4.13.2025:
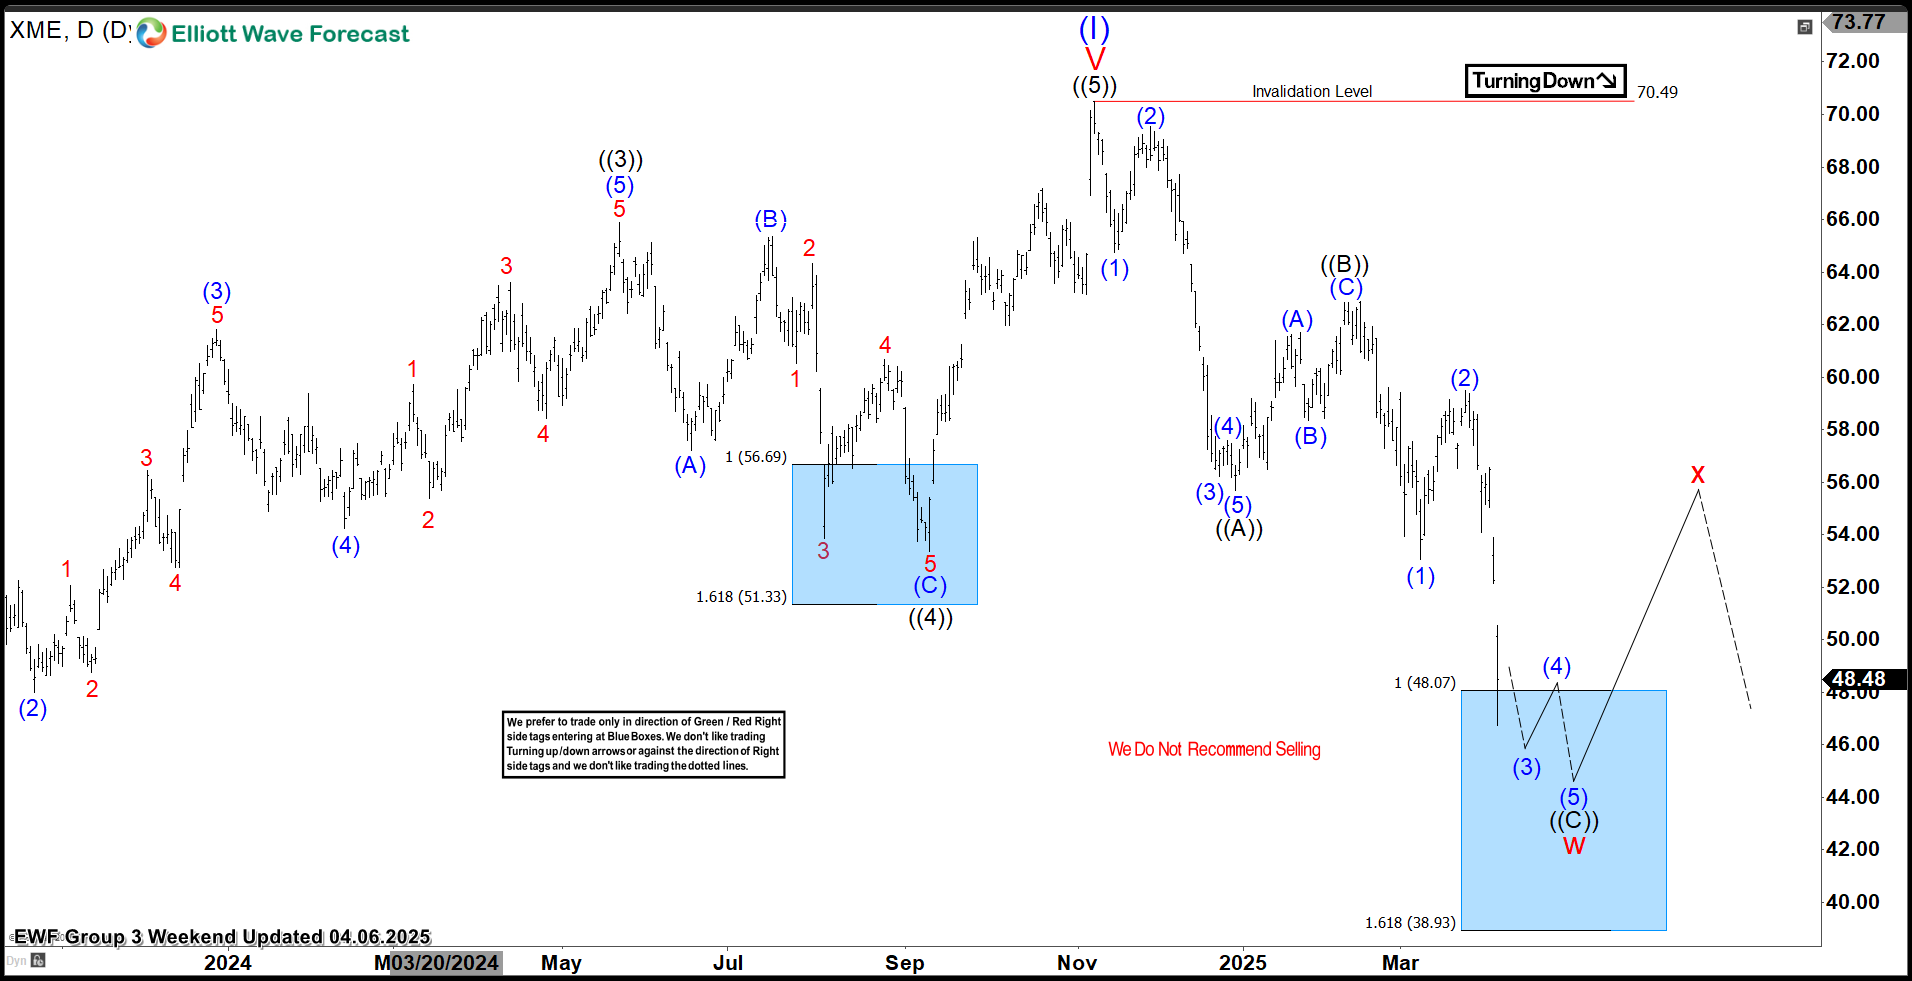
 The most recent update, from April 13, 2025, shows that the ETF bounced as predicted allowing buyers to get risk-free. After the decline from the November peak, the ETF is now finding support in the equal legs area. Currently, it is building a 5-wave impulse in wave ((1)), which should be followed by a pullback in wave ((2)). After that, the market is expected to continue higher in a renewed bullish cycle.
Conclusion
Elliott Wave Forecast
The post SPDR Metals & Mining ETF $XME Blue Box Area Offers A Buying Opportunity appeared first on Elliott wave Forecast.