


7 Swing WXY correction
 Elliott Wave Structure Favors More Downside.")
$XLI 4H Elliott Wave Chart 3.12.2025:
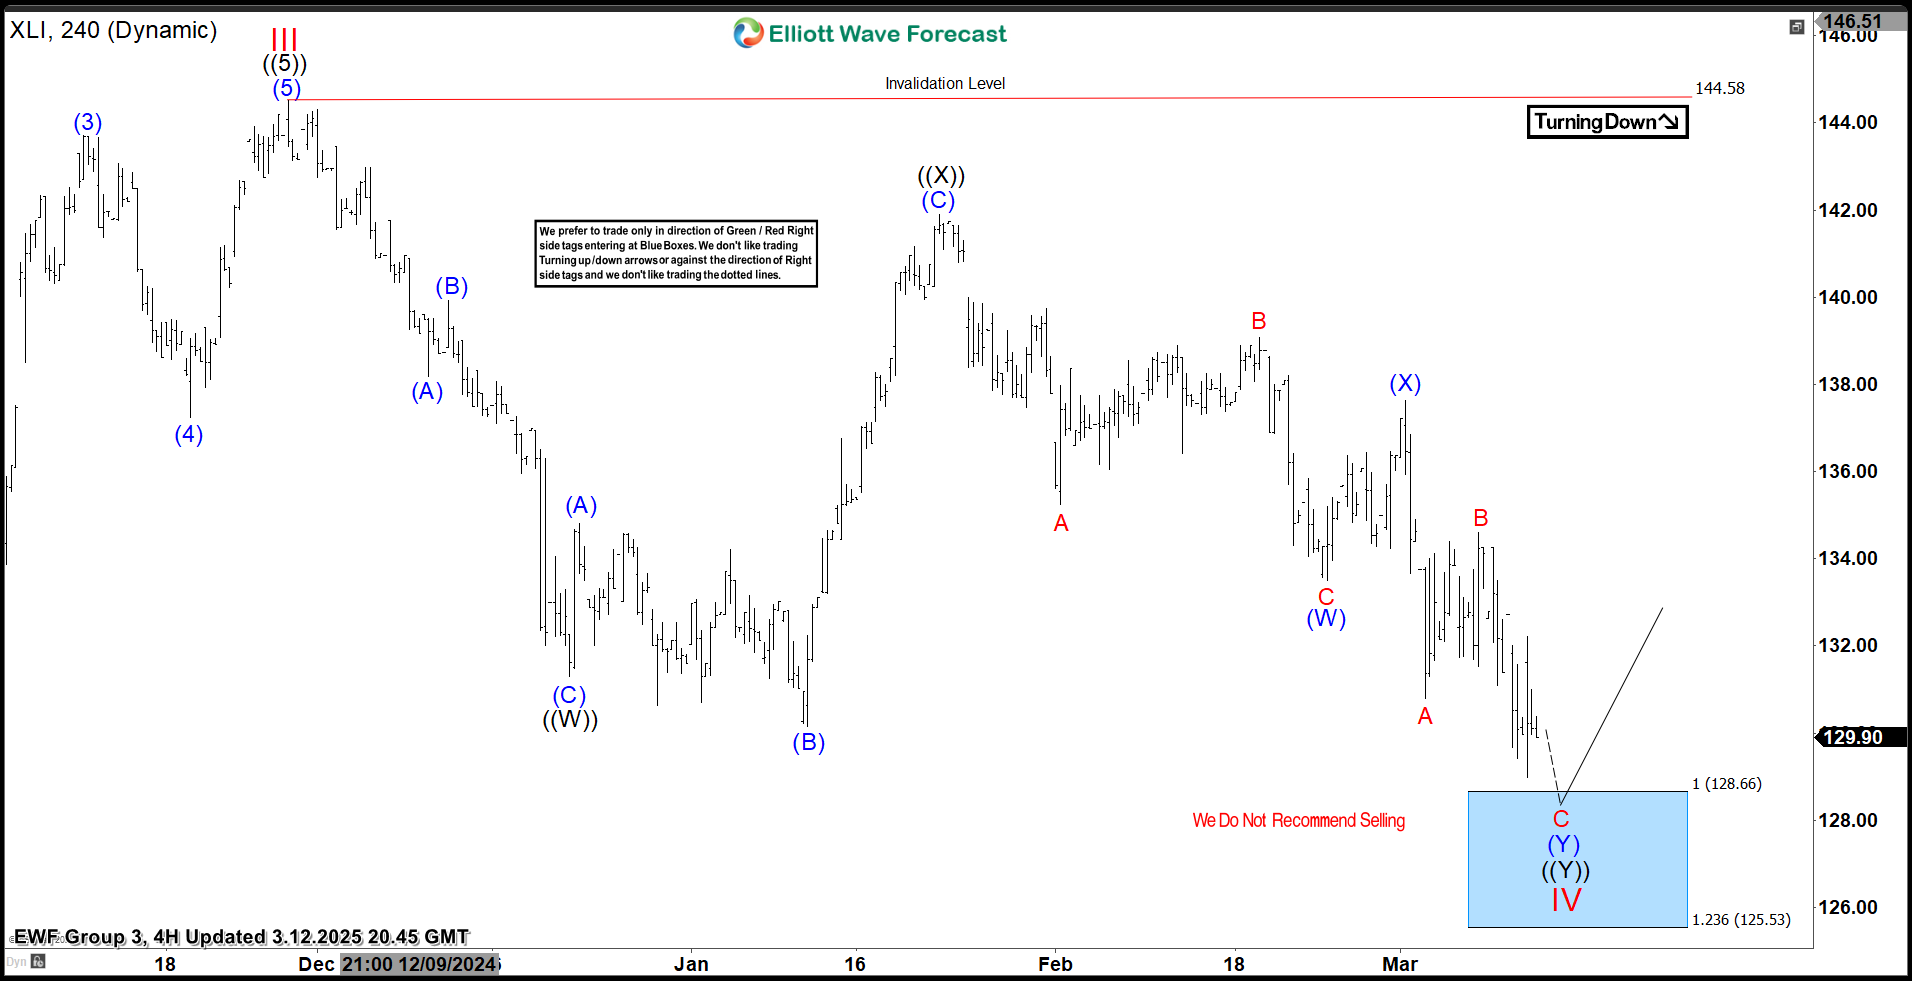 In the 4H Elliott Wave count from March 12, 2025, we saw that $XLI is completing a 7-swing correction beginning on November 27, 2024. We anticipated this pullback to unfold in 7 swings, likely finding buyers in the equal legs area between $128.66 and $125.53. This setup aligns with a typical Elliott Wave correction pattern (WXY), where the market pauses briefly before resuming the main trend.
$XLI 4H Elliott Wave Chart 3.23.2025:
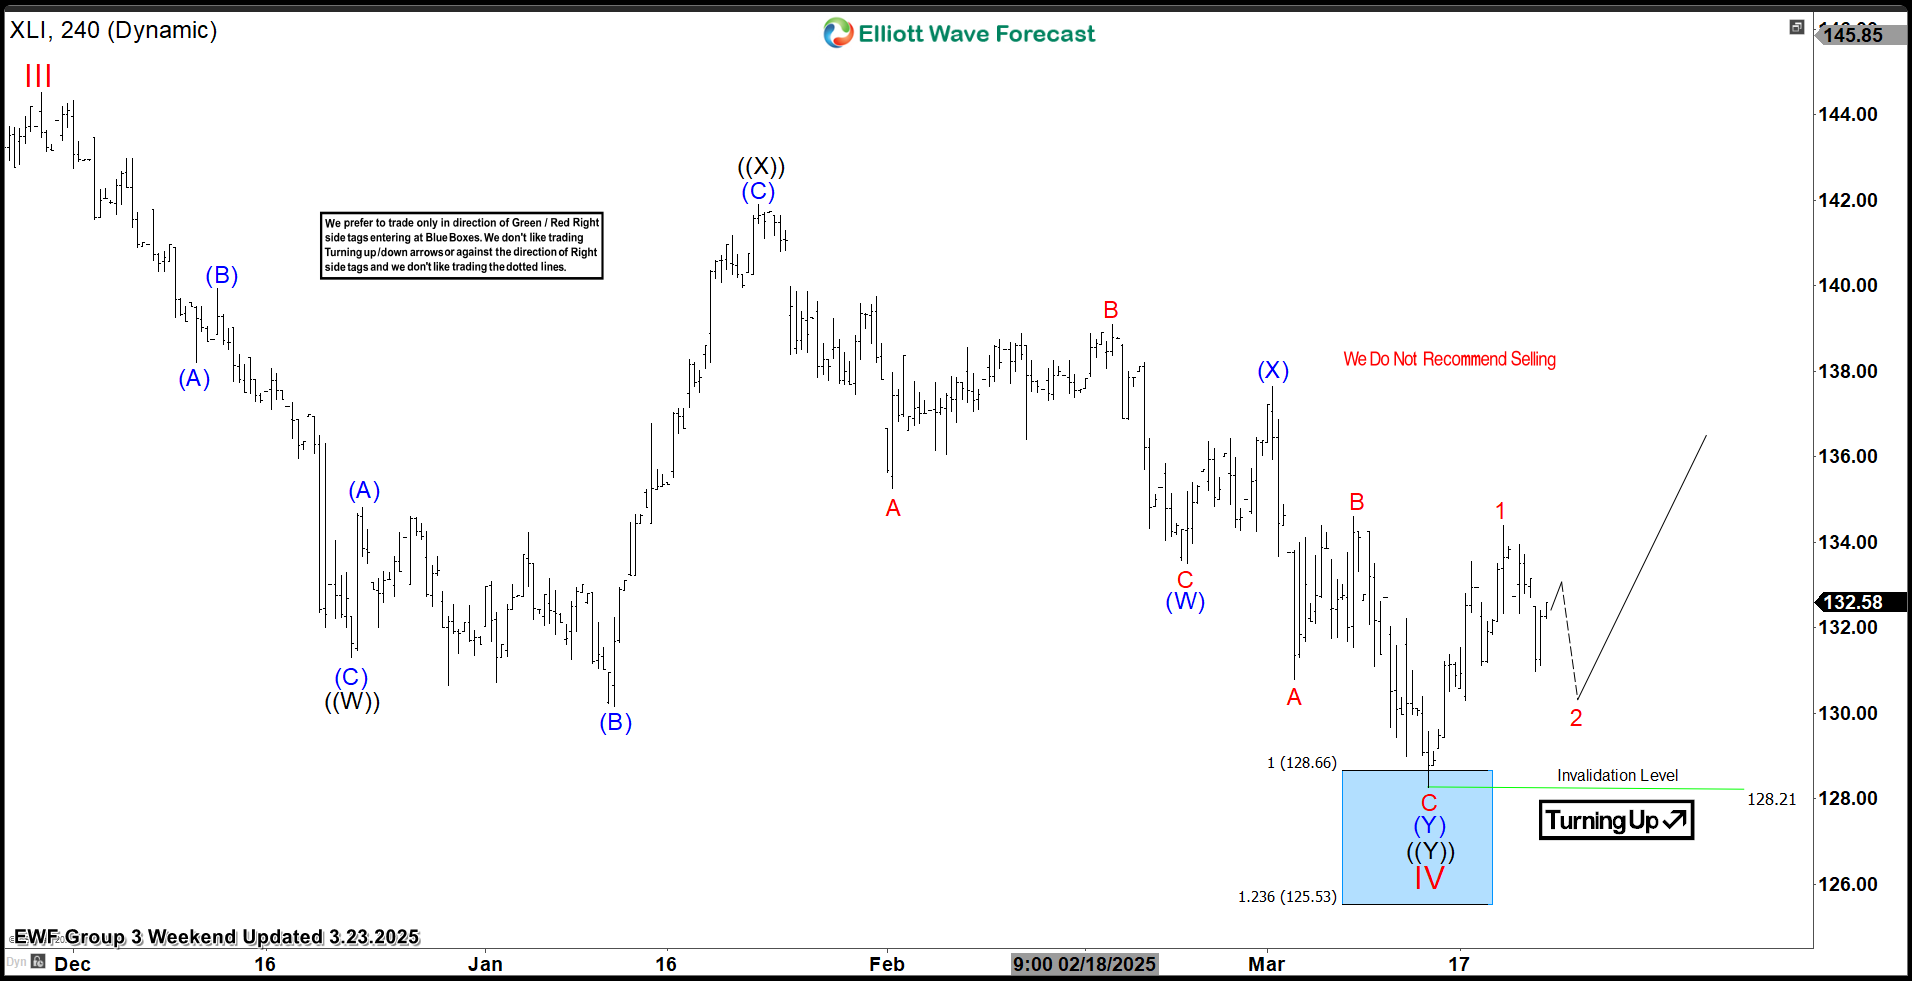 The 4H update, from March 23, 2025, shows the reaction take place as predicted. After the decline from the recent peak, the ETF found support in the equal legs area, leading to a renewed rally. As a result, buyers were able to get risk-free at $135 which is the 50% retracement from the wave ((X)) connector.
What’s Next for $XLI?
With the current price action, the ETF appears to be positioned for a bounce. Based on the Elliott Wave structure, we expect the ETF to remain above 128.21 and trade higher, targeting the $148– $154 range before another potential pullback. Therefore, it is essential to keep monitoring this zone as we approach it.
Conclusion
Elliott Wave Forecast
The post SPDR Industrial ETF $XLI Blue Box Area Offers A Buying Opportunity appeared first on Elliott wave Forecast.