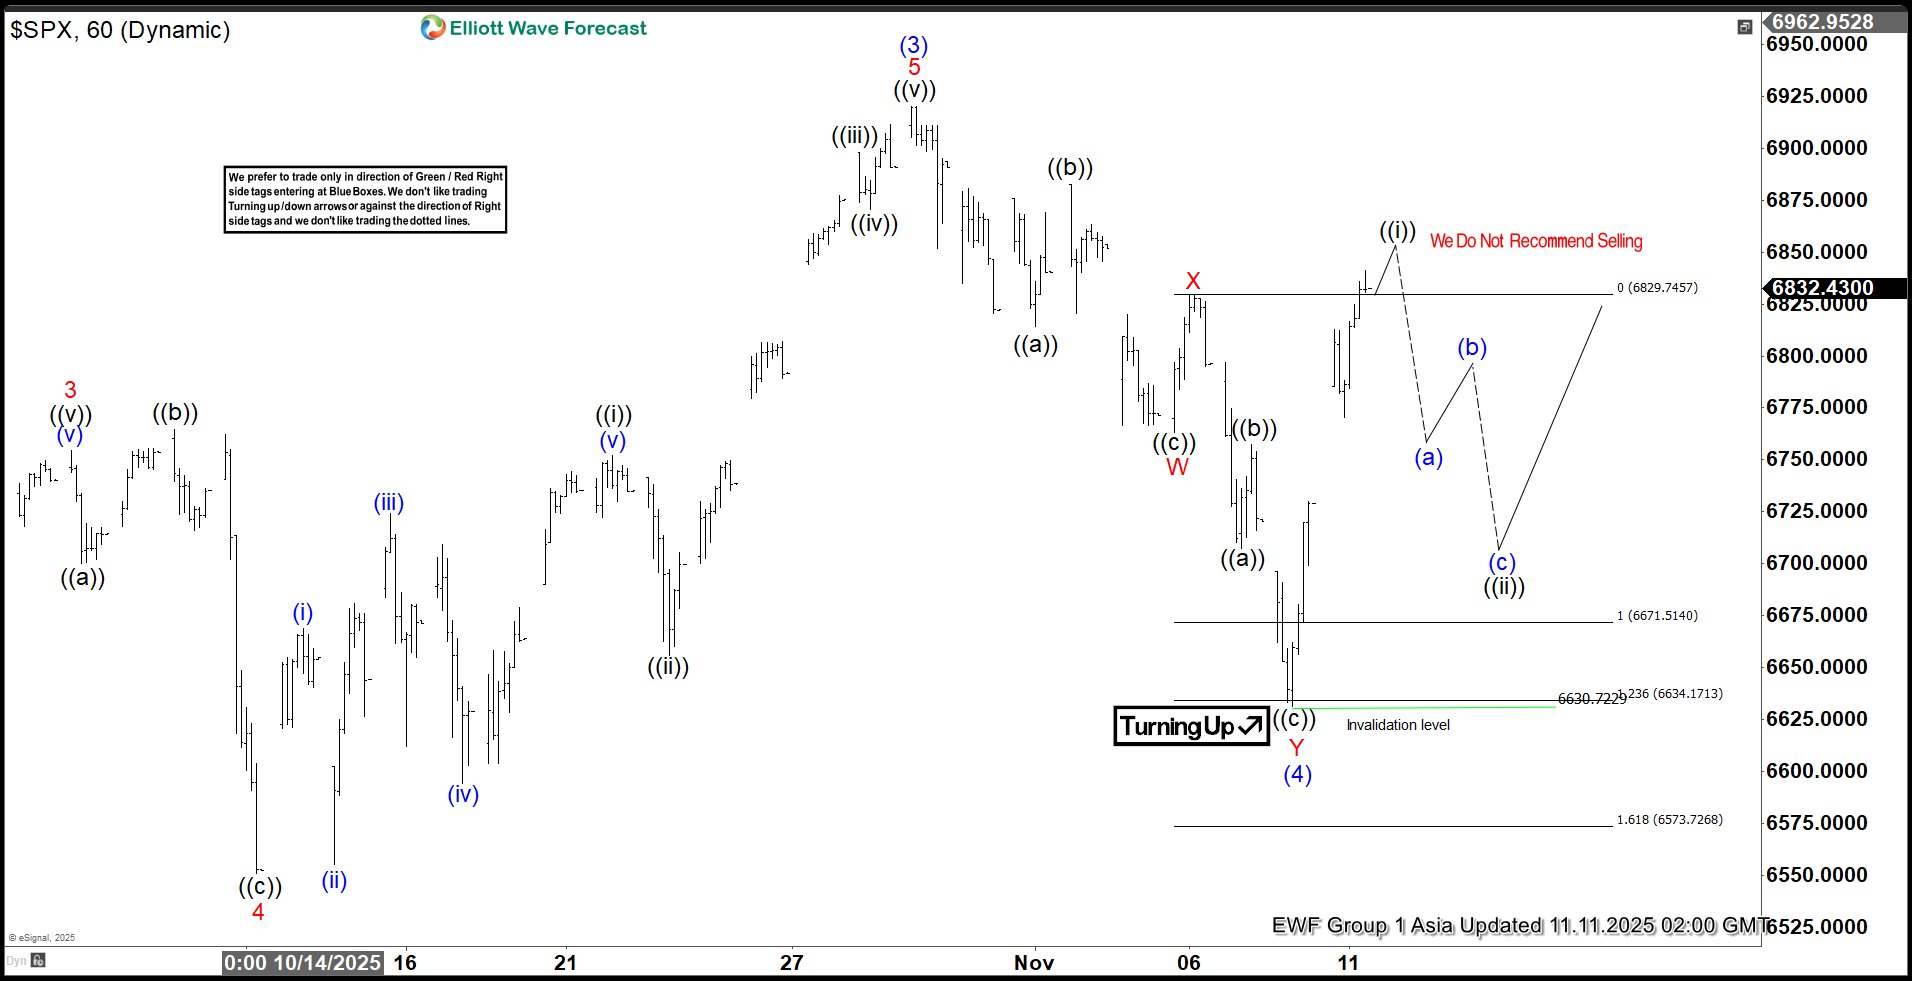
The ongoing cycle in the S&P 500 Index (SPX), originating from the April 2025 low, continues to unfold as an impulsive structure. The advance to 6920.21 marked the completion of wave (3) within this impulse, as illustrated in the accompanying one-hour chart. Subsequently, the market entered a corrective phase in wave (4), which developed as a double three Elliott Wave pattern. From the termination of wave (3), wave ((a)) declined to 6814.26, followed by a recovery in wave ((b)) to 6882.32. The Index then resumed its descent in wave ((c)), reaching 6763.11 and thereby completing wave W of a higher degree. A corrective rally in wave X ensued, peaking at 6829.78. Thereafter, the Index turned lower again, initiating wave Y as a lower-degree zigzag. Within wave Y, wave ((a)) bottomed at 6707.51 and wave ((b)) rebounded to 6757.63. Wave ((c)) extended downward to 6630.72, finalizing wave Y of (4). The Index has since begun to rise in wave (5). However, a decisive break above the wave (3) high at 6920.21 remains necessary to invalidate the possibility of a double correction. From the wave (4) low, wave ((i)) is nearing completion. A pullback in wave ((ii)) is anticipated to correct the cycle from the November 8, 2025 low, likely unfolding in a 3, 7, or 11 swing sequence. In the near term, provided the pivot at 6630.72 remains intact, any pullback should find support within the expected swing structure, paving the way for further upside continuation.
SPX 1-Hour Elliott Wave Chart From 11.11.2025
The post S&P 500 (SPX) Eyes Fresh All-Time High in Wave (5) appeared first on Elliott Wave Forecast.


