

The short term price action in OIL suggests that the decline from 23rd June 2025 peak ended in 3 waves structure. Up from there, it has made a 5 waves bounce from the lows therefore we suspect that it can be correcting that cycle in simple zigzag correction into the path to the next sell zone. Now lets take a look at this hourly chart below:
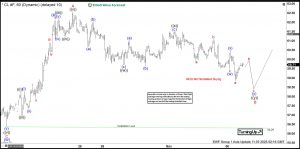
OIL 1-Hour Elliott Wave Chart From 11.07.2025
 Above is the latest hourly view on OIL from 11.07.2025 Asia update. In which, the decline from $56.29 low has completed wave (W) of the decline from 6.23.2025 peak. Up from there, the bounce unfolded in 5 waves impulse sequence where wave ((i)) ended at $58.27 high. Wave ((ii)) pullback ended at 56.99 low, wave ((iii)) rallied towards $62.20 and wave ((iv)) ended at $61.21 low. Then a new high towards $62.59 high ended wave ((v)) thus completed wave A of a zigzag correction. Down from there, OIL is correcting the cycle from 10.20.2025 low in wave B pullback. The internals of this ongoing pullback is taking place as double three correction where wave ((w)) ended in lesser degree 3 waves at $59.70 low. Then another 3 wave bounce ended wave ((x)) at $61.50 high. Since than, wave ((y)) is unfolding in another 3 waves. But it can reach $58.61- $56.82 area lower first before starting the C leg higher.
OIL Elliott Wave Video:
The post From Bounce to Barrier: Oil Path to the Next Sell Zone appeared first on Elliott Wave Forecast.