
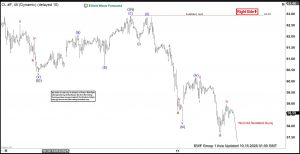

The short-term Elliott Wave analysis for oil indicates that a decline from the September 26, 2025, high is unfolding as a five-wave impulse. Starting from that peak, wave ((i)) concluded at $60.40, as depicted on the 45-minute chart. Subsequently, wave ((ii)) rallied in a zigzag Elliott Wave pattern. From the low of wave ((i)), wave (a) reached $62.12, followed by a pullback in wave (b) to $60.72. The upward move in wave (c) peaked at $62.93, completing wave ((ii)) at a higher degree. Oil then continued its descent in wave ((iii)), structured as an impulsive sequence. From the wave ((ii)) high, wave (i) dropped to $61.78, and wave (ii) corrected to $62.87. Wave (iii) extended lower to $58.22, with a bounce in wave (iv) reaching $60.17. In the near term, as long as the pivot at $62.93 holds, any rally is expected to falter in a 3, 7, or 11-swing pattern, leading to further declines. The potential downside target lies between $53.2 and $56.9, based on the 100% to 161.8% Fibonacci extension of wave ((i)). This analysis suggests continued bearish momentum, with limited upside potential unless the key pivot is breached. Oil (CL) – 45 Minute Elliott Wave Technical Chart:

CL – Elliott Wave Technical Video:
The post Elliott Wave Analysis: Light Crude Oil (CL) Weakness Expected to Persist appeared first on Elliott Wave Forecast.