The July 2025 Soar
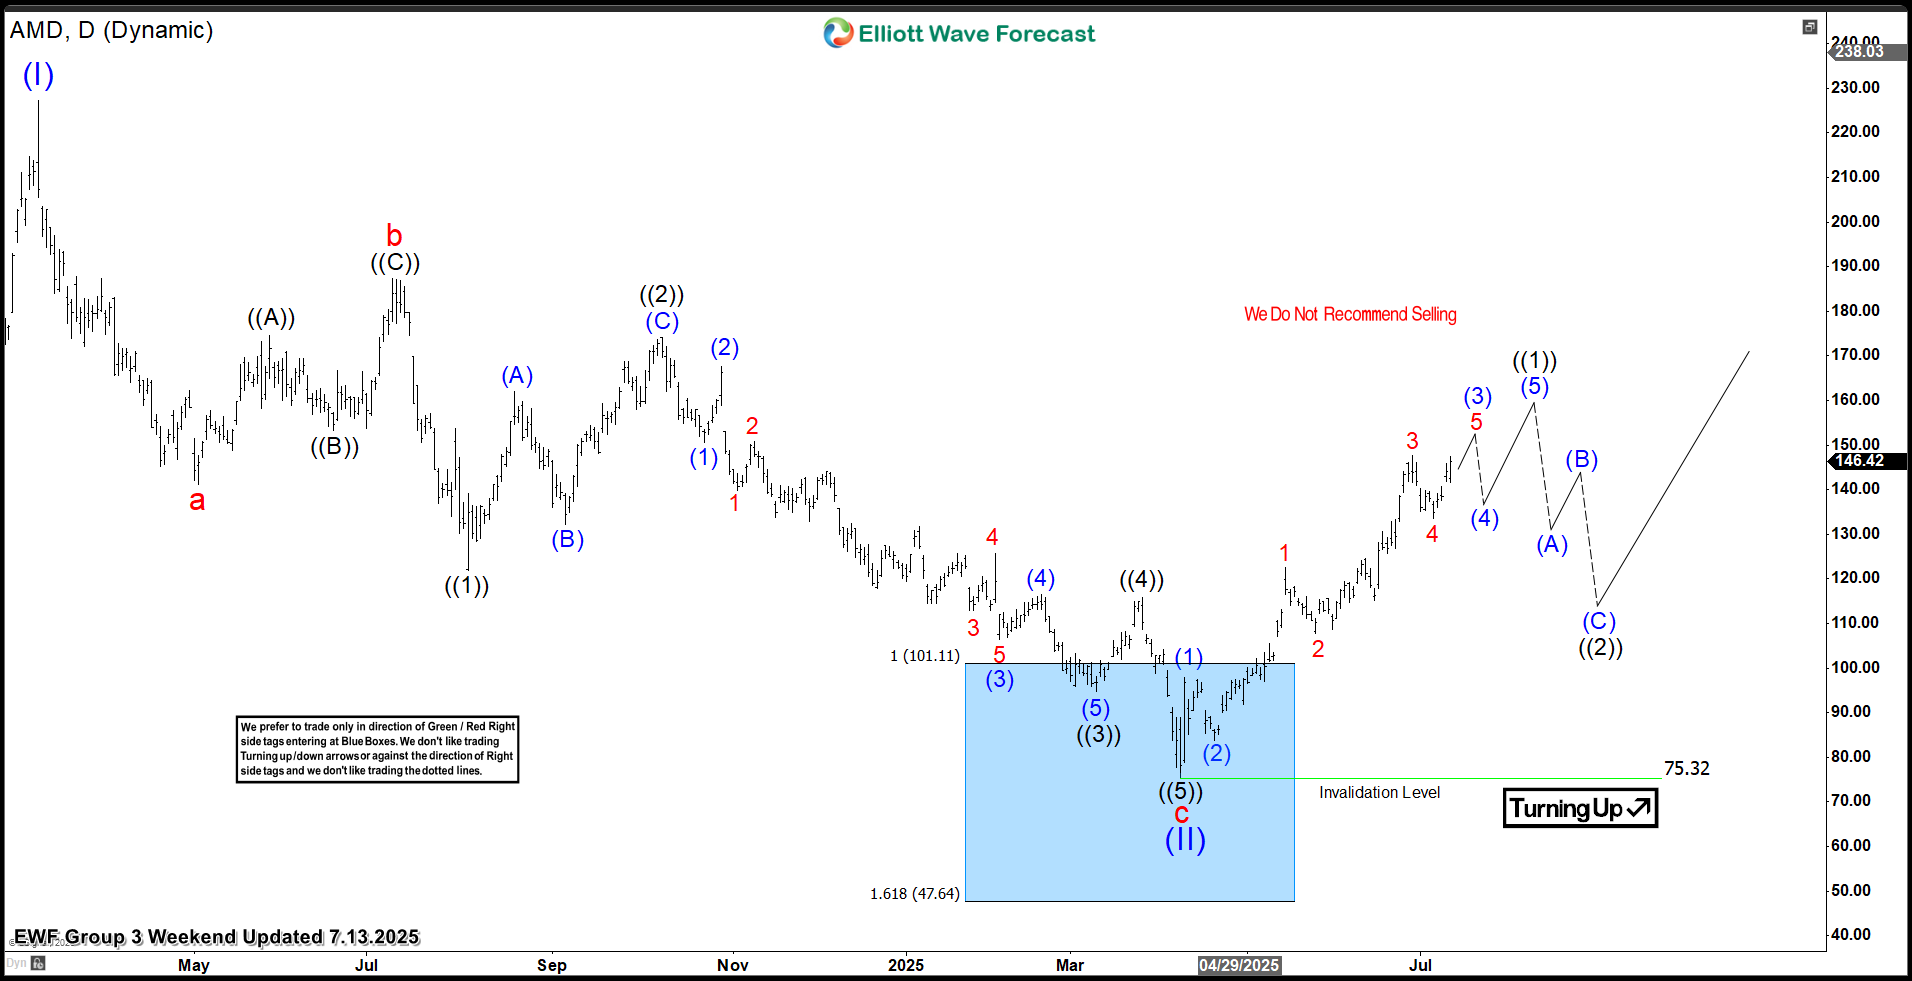
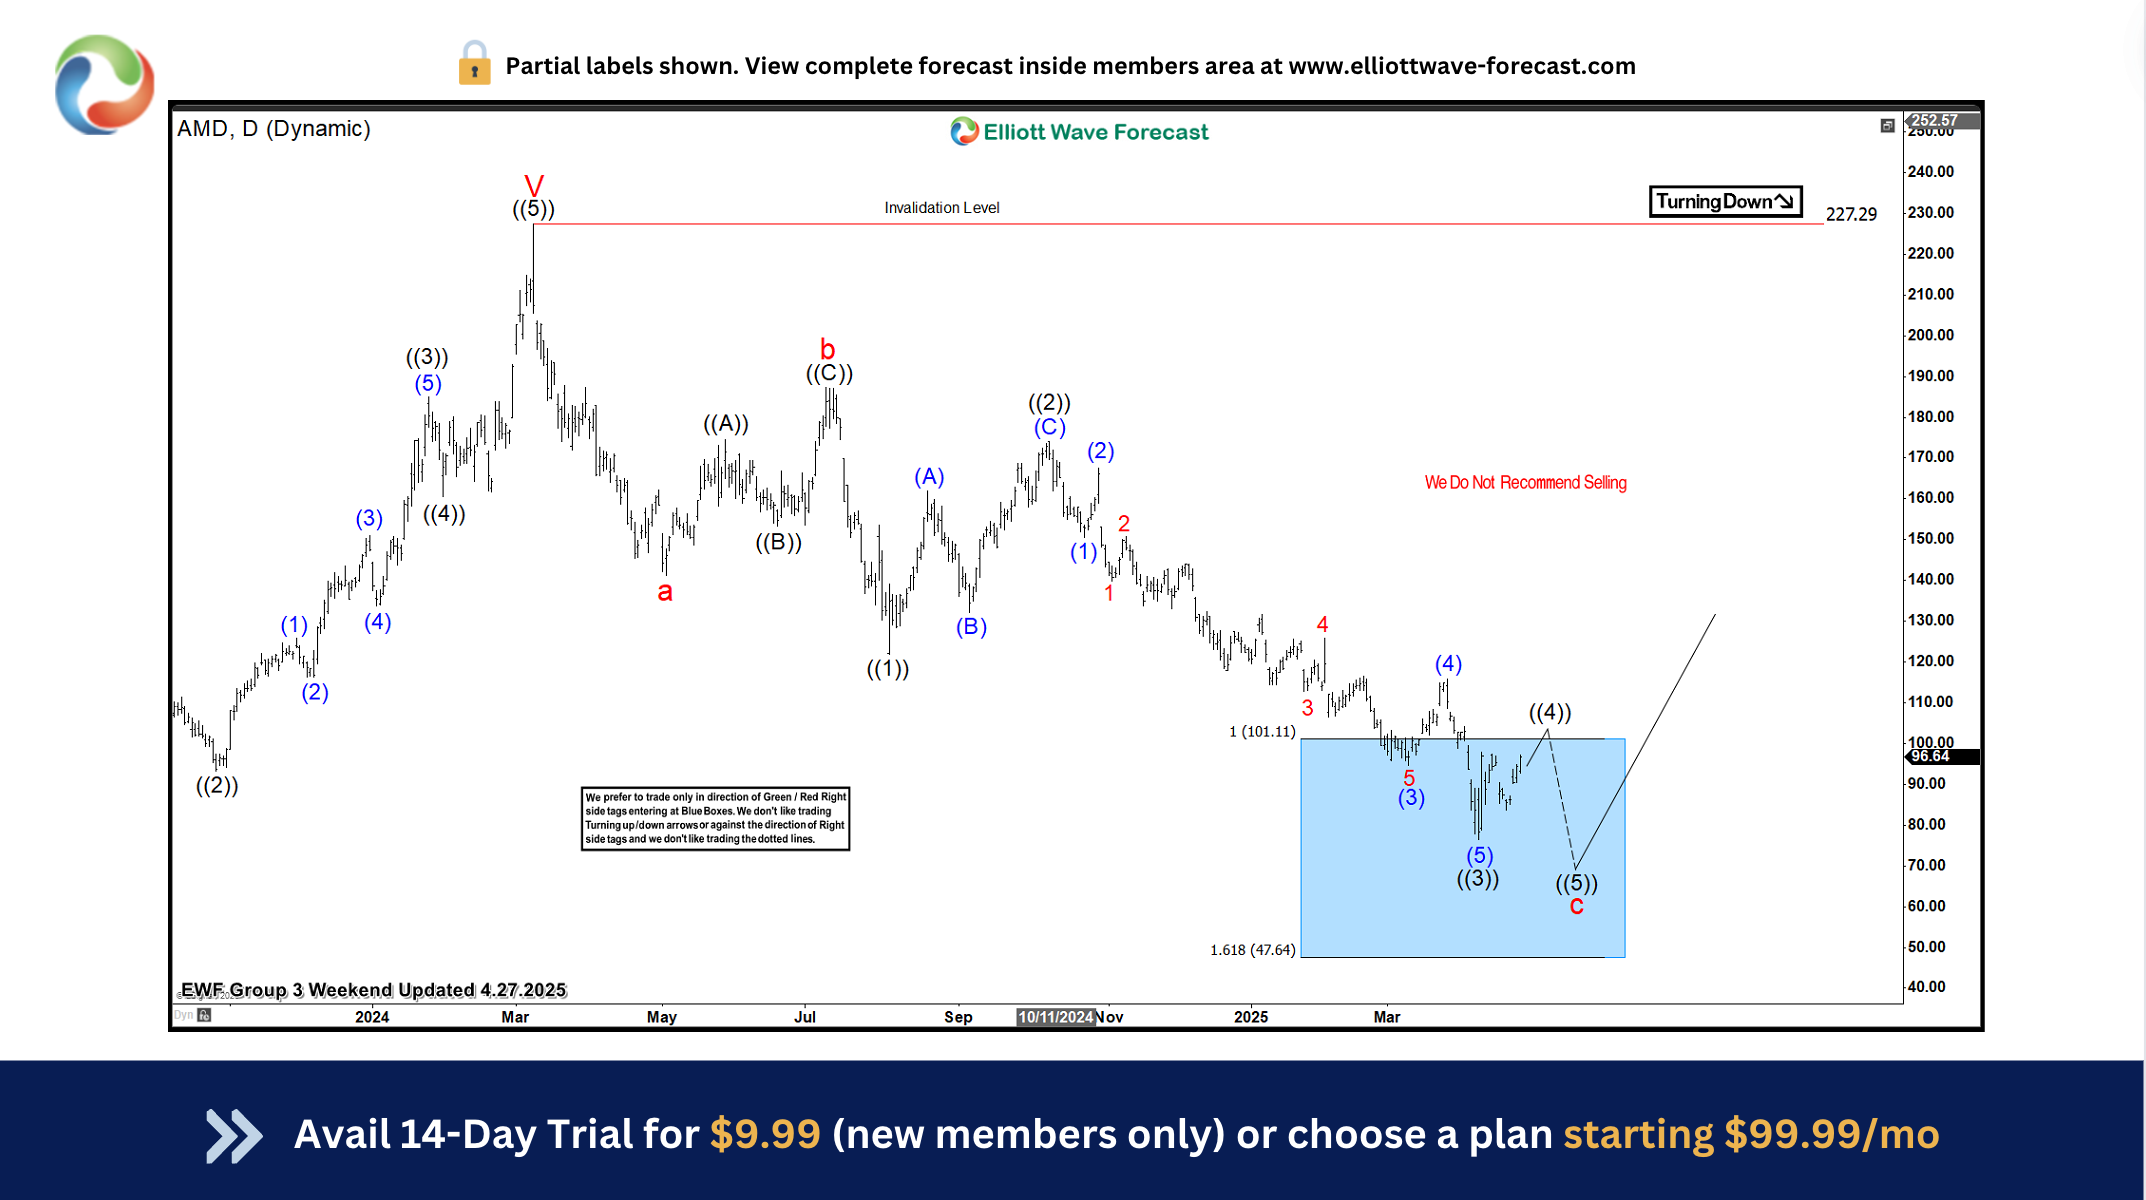
 Fast forward to July 13, 2025, as seen above. This chart strikingly demonstrates the strong reaction from the April 2025 blue box area. From the low within the blue box, $AMD has indeed surged, exhibiting a clear five-wave impulsive structure. Comparing the two charts, the most significant extension higher is evident in the current price action. In the April chart, the market was still in the corrective phase, potentially forming the (II) wave within the blue box. The July chart shows that from that blue box low, $AMD has embarked on a powerful rally. The rally has unfolded with distinct sub-waves, particularly noticeable in the extension of wave 3, which then corrected in wave 4, and is currently extending higher in wave (3).
The October 2025 Breakout
 Fast forward another three months to our latest 4H update from Oct 06, 2025, and the charts tell a compelling story. $AMD was able to soar and break above August 13,2025 high at black ((1)) opening an incomplete bullish sequence towards $260 – 326 area before the cycle from April 2025 can end. Right now, the stock is still climbing. It is in what we call wave (3) of wave ((3)). This means more gains are likely. We think $AMD could reach $260–$326 next. After that, we might see another pullback.
 Elliott Wave Forecast
The post Advanced Micro Devices $AMD Soars 200% from Blue Box Area, With $260 Target Still Ahead appeared first on Elliott Wave Forecast.


