
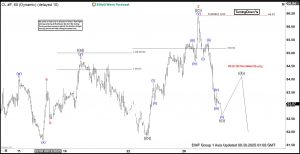

The short-term Elliott Wave structure in crude oil indicates a downward cycle from the June 23, 2025, high, unfolding as a five-wave impulse. Wave 1 concluded at $61.45, and wave 2 rallied to $66.42, as shown on the 1-hour chart. Wave 2 developed as a regular flat structure. From wave 1’s low, wave ((a)) peaked at $64.76. Wave ((b)) fell to $61.85, and wave ((c)) advanced to $66.42, finalizing wave 2. Oil now declines in wave 3, structured as an impulse. From wave 2’s high, wave (i) reached $64.87, and wave (ii) corrected to $65.40. Wave (iii) dropped to $62.98, followed by wave (iv) at $63.50. Oil should extend lower in wave (v) to complete wave ((i)) of 3. Afterward, a wave ((ii)) rally will likely adjust the decline from the September 26, 2025, high in a 3, 7, or 11-swing pattern before resuming downward. As long as the $66.42 pivot high remains intact, near-term rallies are expected to fail in a 3, 7, or 11-swing sequence, leading to further declines. This structure suggests oil faces continued bearish pressure in the short term, with limited upside potential unless the pivot breaks. Oil (CL) – 60 Minute Elliott Wave Technical Chart:

CL – Elliott Wave Technical Video:
The post Light Crude Oil (CL) Elliott Wave Outlook Points to Lower Prices appeared first on Elliott Wave Forecast.