

7 Swings WXY correction
 Elliott Wave Structure Favors More Downside.")
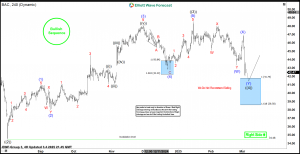
$BAC 4H Elliott Wave Chart 3.04.2025:
 In the 4-hour Elliott Wave count from March 04, 2025, we see that $BAC completed a 5-wave impulsive cycle beginning on August 05, 2024, and ending on January 16, 2025, at the black ((3)). As expected, this initial wave prompted a pullback. We anticipated this pullback to unfold in 7 swings, likely finding buyers in the equal legs area between $41.79 and $38.58.
This setup aligns with a typical Elliott Wave correction pattern (WXY), where the market pauses briefly before resuming the main trend.
$BAC 4H Elliott Wave Chart 3.16.2025:
 The update, from March 16, 2025, shows that $BAC is reacting as predicted. After the decline from the recent peak, the stock found support in the equal legs area, leading to a bounce. As a result, traders should get ready to go risk-free.
Conclusion
In conclusion, our Elliott Wave analysis of $BAC suggested that it could bounce in the short term. Therefore, traders should be proactive and get risk-free soon while keeping an eye out for any corrective pullbacks. By using Elliott Wave Theory, we can identify potential buying areas and enhance risk management in volatile markets.
Elliott Wave Forecast
We cover 78 instruments, but not every chart is a trading recommendation. We present Official Trading Recommendations in the Live Trading Room. If not a member yet, Sign Up for 14 days Trial now and get access to new trading opportunities. Welcome to Elliott Wave Forecast!
The post Bank of America Corp. $BAC Blue Box Area Offered A Buying Opportunity appeared first on Elliott wave Forecast.