

Hello traders. In this technical article we’re going to look at the Elliott Wave charts of Oil commodity (CL_F) published in members area of the website. OIL has recently given us a 3 waves recovery that found sellers precisely at the equal legs area as we expected. In this discussion, we’ll break down the Elliott Wave pattern and forecast.
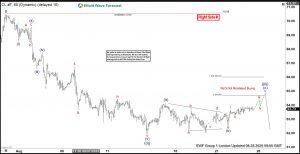
OIL Elliott Wave 1 Hour Chart 08.25.2025
OIL is giving us correction against the 70.58 peak. We expect to see another leg up toward 64.68-66.01 area to complete a 3 waves (a)(b)(c) pattern. Our members know that we identify potential reversal zones using the Equal Legs technique. As long as the price stays within this region, we expect sellers to take control and push it down toward new lows. We recommended that members avoid buying the OIL at this stage, while favoring the short side.
You can learn more about Elliott Wave Patterns at our Free Elliott Wave Educational Web Page
90% of traders fail because they don’t understand market patterns. Are you in the top 10%? Test yourself with this advanced Elliott Wave Test 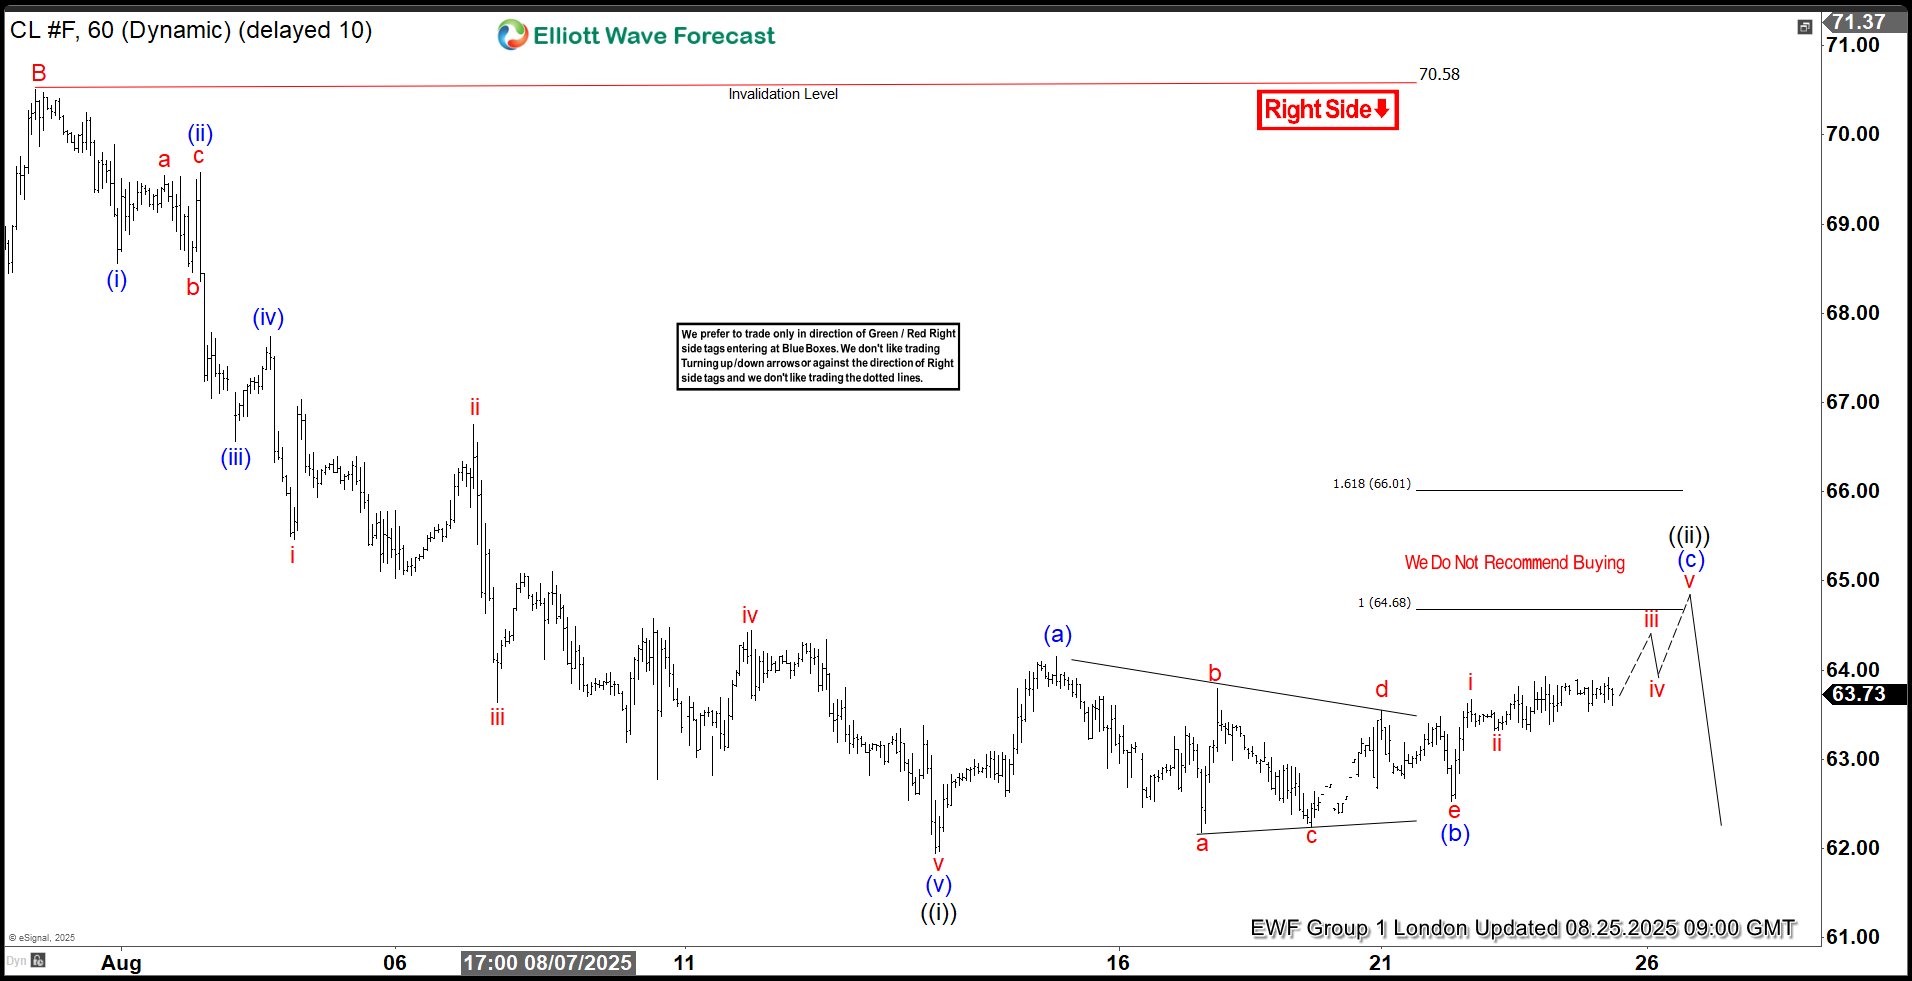
OIL Elliott Wave 1 Hour Chart 08.27.2025
A 2 days later, we can see the result. OIL reached the proposed equal legs area and found sellers, as expected. We got a decent reaction from the sellers’ zone. The recovery peaked at 65.1. As long as it remains below that high, the next leg down may be in progress Remember, the market is dynamic, and the presented view may have changed in the meantime. For the most recent charts and target levels, please refer to the membership area of the site. The best instruments to trade are those with incomplete bullish or bearish swing sequences. We put them in Sequence Report and best among them are presented in the Live Trading Room Reminder for members: Our chat rooms in the membership area are available 24 hours a day, providing expert insights on market trends and Elliott Wave analysis. Don’t hesitate to reach out with any questions about the market, Elliott Wave patterns, or technical analysis. We’re here to help. 
Elliott Wave Forecast
At Elliott Wave Forecast, we track and analyze 78 instruments daily — but remember, not every chart is a direct trading signal.
For real-time, actionable trades, join our Live Trading Room, where we guide you through clear, professional setups every day.
🚀 Not a member yet? Now’s the perfect time, we have limited time Promo Offer :
Unlock full access with our 14-day Trial for just $0.99!
Here’s what you’ll get:
✅ Official Trading Signals — with clearly defined Entry, Stop Loss, and Take Profit levels based on our proven strategy.
✅ Live 24 Hour Chat Room Access — ask unlimited questions and get expert support during trading hours (Monday–Friday).
✅ Expert Analysis — real-time updates across Forex, Stocks, Indices, Commodities, Cryptos, and ETFs.
✅ Hands-on Learning — sharpen your trading skills with direct mentorship from seasoned market analysts.
💬 Whether you’re an experienced trader or just getting started, Elliott Wave Forecast provides the tools, strategies, and support you need to trade with confidence.
Take the first step toward better, smarter trading 👉 Click here to start your Trial today!

The post OIL (CL_F) Elliott Wave : Calling the Decline From the Equal Legs Area appeared first on Elliott Wave Forecast.