

5 Wave Impulse Structure + ABC correction
’s Impressive Rally and What’s Coming Next")
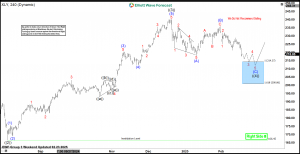
$XLY 4H Elliott Wave Chart 2.23.2025:
 In the 4H Elliott Wave count from February 23, 2025, we see that $XLY completed a 5-wave impulsive cycle beginning on August 05, 2024, and ending on December 18, 2024, at the black ((3)). As expected, this initial wave prompted a pullback. We anticipated this pullback to unfold in 3 swings first, likely finding buyers in the equal legs area between $214.27 and $200.86. This setup aligns with a typical Elliott Wave correction pattern (ABC), where the market pauses briefly before resuming the main trend.
$XLY 4H Elliott Wave Chart 3.02.2025:
 The most recent update, from March 02, 2024, shows that The ETF traded lower as predicted. After the decline from the December peak, the ETF is finding support in the equal legs area, looking for a low.
What’s Next for $XLY?
With the current price action, the ETF appears to be positioned for a bounce. Based on the Elliott Wave structure, we expect the ETF to find a low soon and trade higher, targeting the $226 – $229 range before another potential pullback. Therefore, it is essential to keep monitoring this zone as we approach it.
Conclusion
Elliott Wave Forecast
The post Consumer Discretionary ETF $XLY Blue Box Area Offers A Buying Opportunity appeared first on Elliott wave Forecast.