

Hello traders. Welcome to another blog post where we discuss recent trade setups from the blue box. In this post, the spotlight will be on the Bank of America, BAC with the ticker $BAC. The stock recently reached the blue box where buyers went long. How did we come about this setup and what should traders expect next? Bank of America (BAC) is a leading U.S. financial institution, offering banking, wealth management, and corporate finance services. Its stock movements attract traders, making it a key player in market trends. BAC is still recovering from the 2008 financial crisis. After bottoming near $2.50 in May 2009, it has followed a bullish trajectory but has yet to reclaim its pre-crash high of $55 from November 2006. If the price breaks above its January/February 2022 high, a new peak could be within reach. After recovery from the sell-off between February 2022 and October 2023, the stock has emerged into a clear bullish sequence. This bullish sequence should eventually breach the February 2022 high. Afterwards, a pullback should happen, correcting the entire bullish cycle from March 2009. However, before the expected pullback emerge, it will be interesting to know if the stock will take November 2006 high for a fresh record high. For now, we can at least expect one more 5-wave leg from the low of February 2025. With this bias, we decided to continue to buy pullbacks in 3, 7 or 11 swing setups until the bullish cycle from March 2009 is exhausted. For Elliottwave-Forecast members, we indicate buying area with the blue box on our charts. On 6th December 2024, I made a post of the last blue box trade on this stock for that year. You can read the post by clicking. Price rebounded from the blue box to reach the expected targets. Meanwhile, shortly after price reached the target, another pullback emerged. We will discuss that below.
BAC Elliott Wave Analysis. 02.27.2025 Update
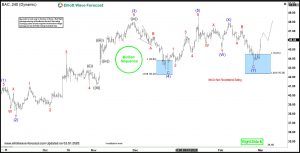
A new pullback emerged from the high of 01.16.2025 and descended for over five weeks. We discovered a 7-swing corrective structure was emerging. Thus, we printed the blue box on the H4 chart where we advised members to go long at the first price of the box and stop a little below the last price. We shared the chart below on 02.27.2025. 
BAC Elliott Wave Analysis. 03.01.2025 Update

About Elliott Wave Forecast
At www.elliottwave-forecast.com, we update one-hour charts four times daily and four-hour charts once daily for all 78 instruments. We also conduct daily live sessions to guide clients on the right side of the market. Additionally, we have a chat room where moderators answer market-related questions. Experience our service with a 14-day trial for only $0.99. Cancel anytime by contacting us at support@elliottwave-forecast.com.
The post BAC Rebounds From Blue Box, Buyers Hit Easy Target appeared first on Elliott wave Forecast.